
May 2026 — British Columbia
How accurate is a phone-based LiDAR scanner at measuring logs? Not “close enough for a guess” — genuinely accurate, scan after scan, log after log?
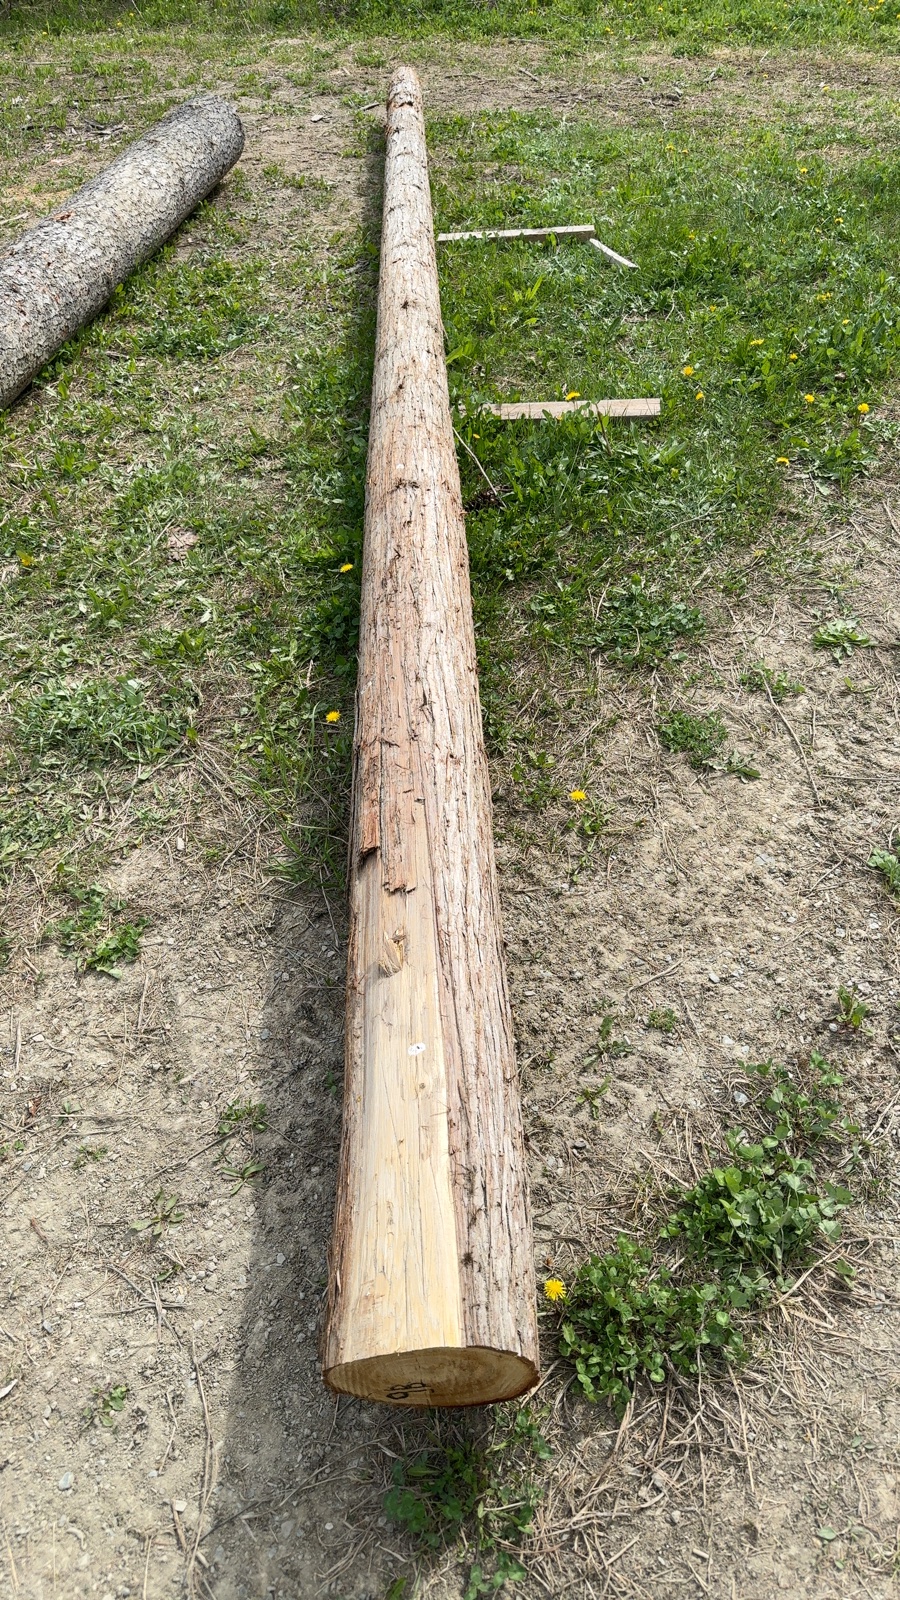
We took nine logs at a landing in BC, tape-measured each one, then scanned every log ten times with LogScanner on an iPhone 15 Pro. Same logs, same conditions, same operator. The goal was simple: measure everything, hide nothing, and publish the results.
Test Setup
Device
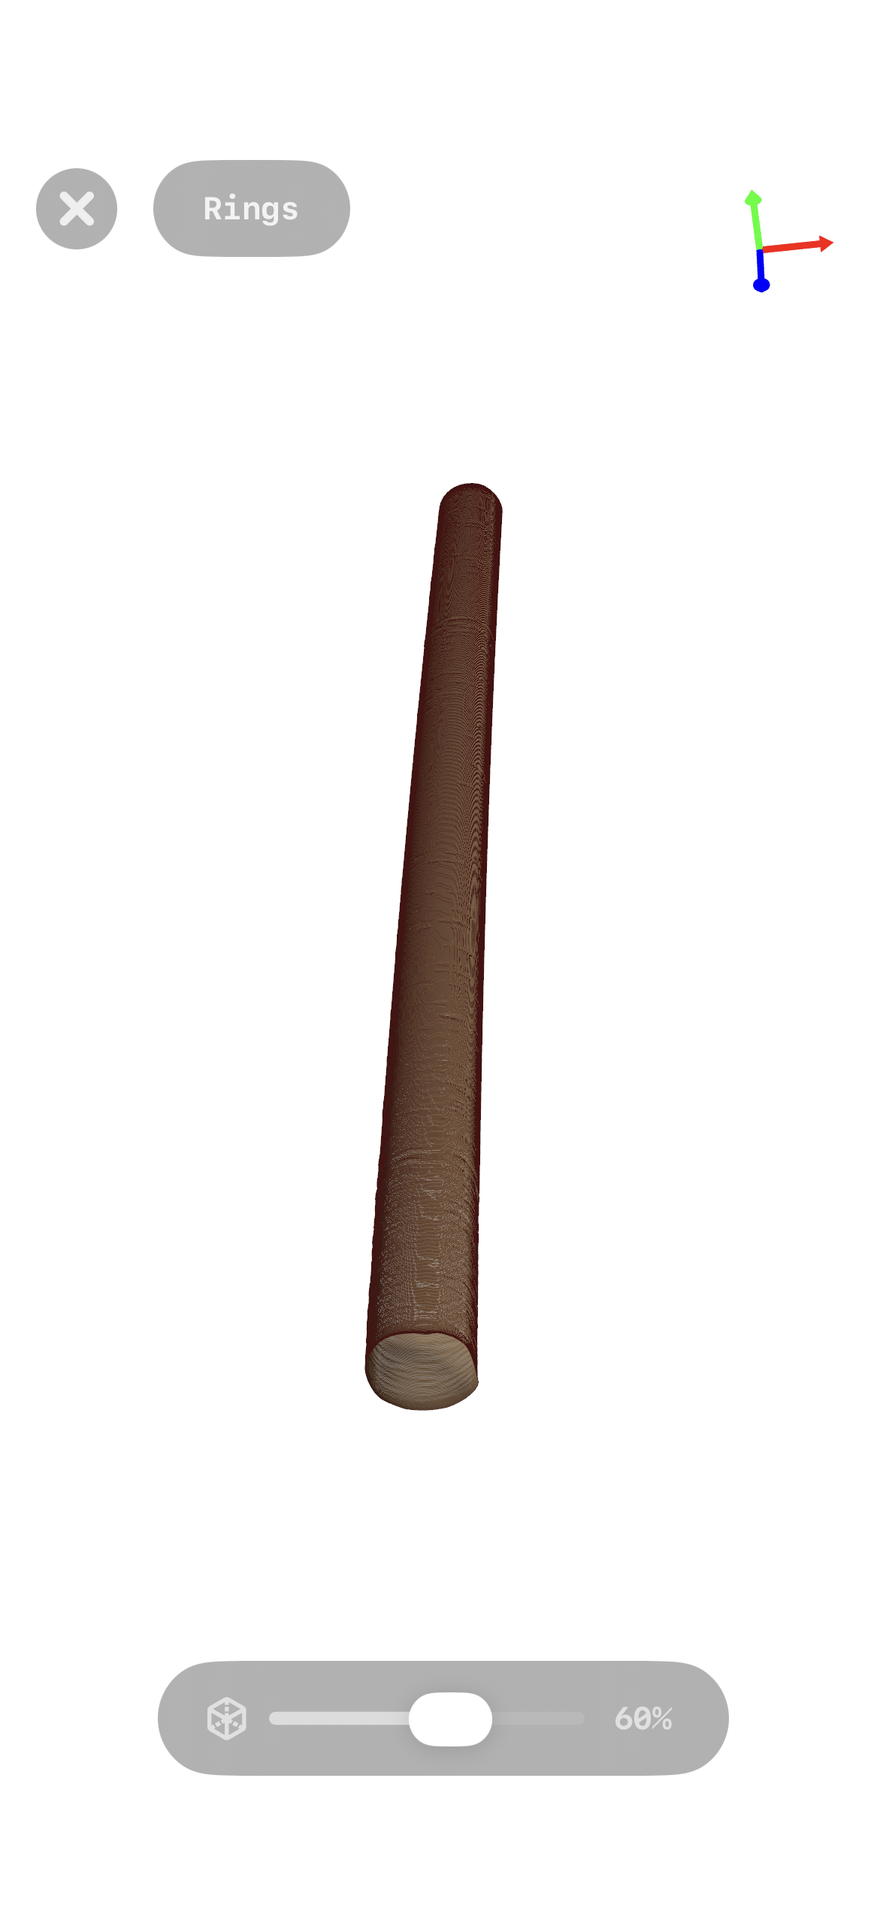
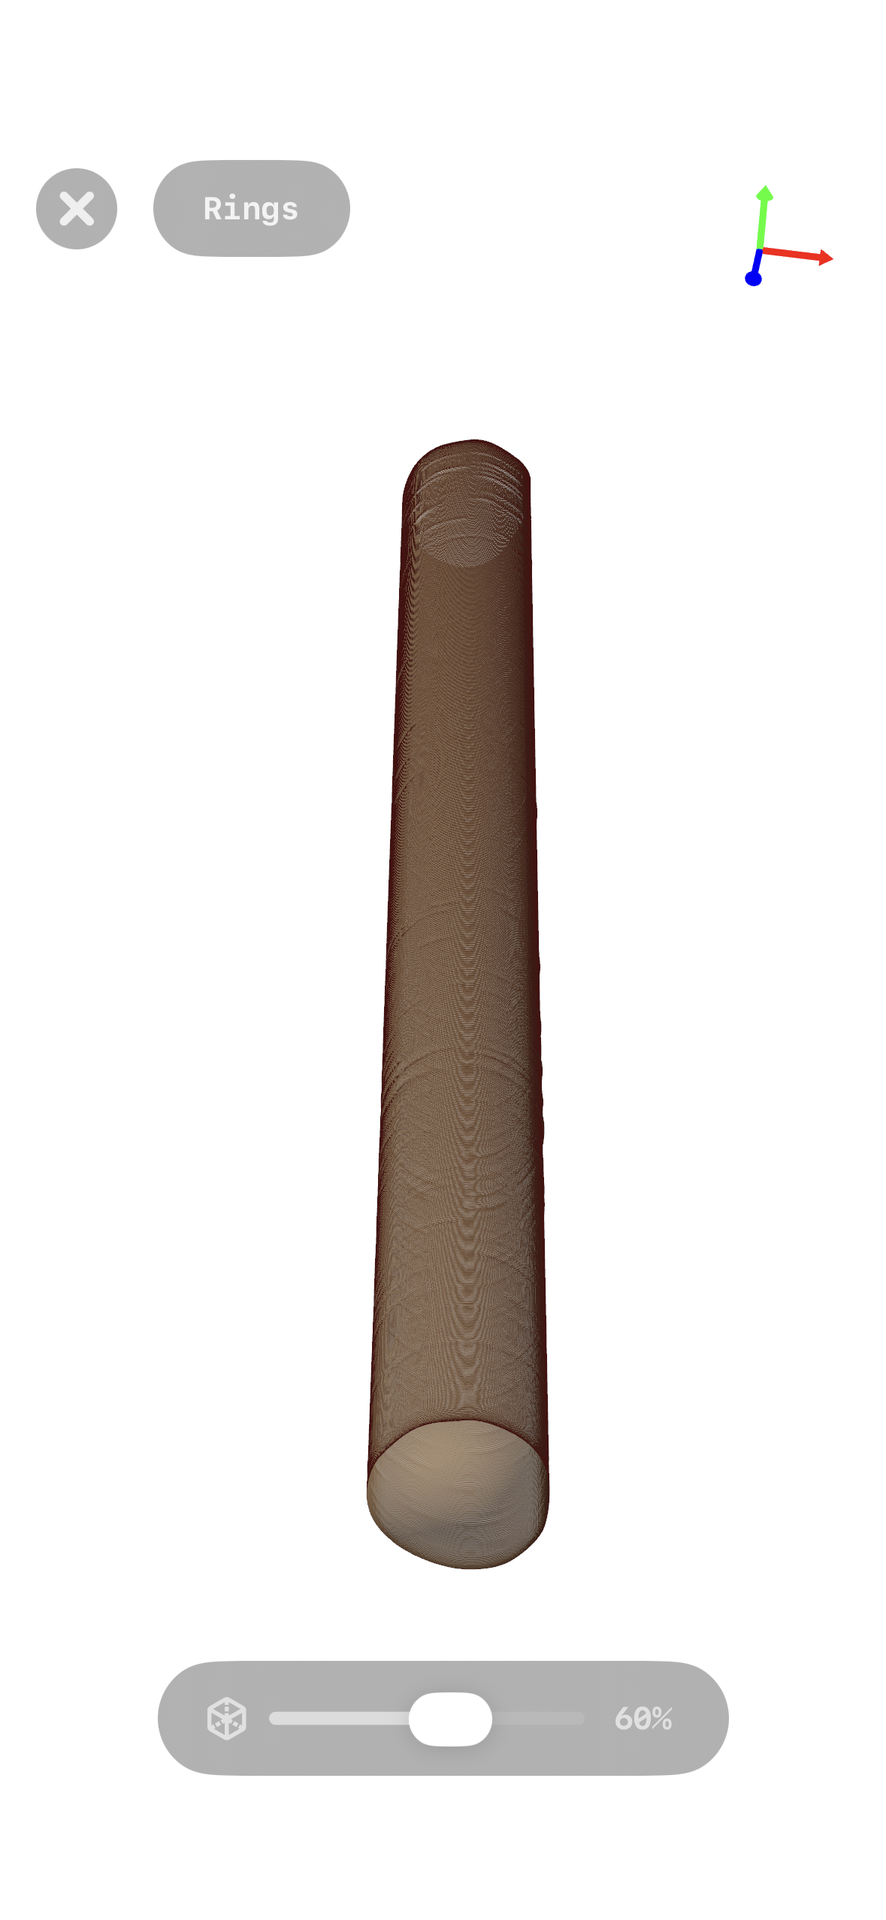
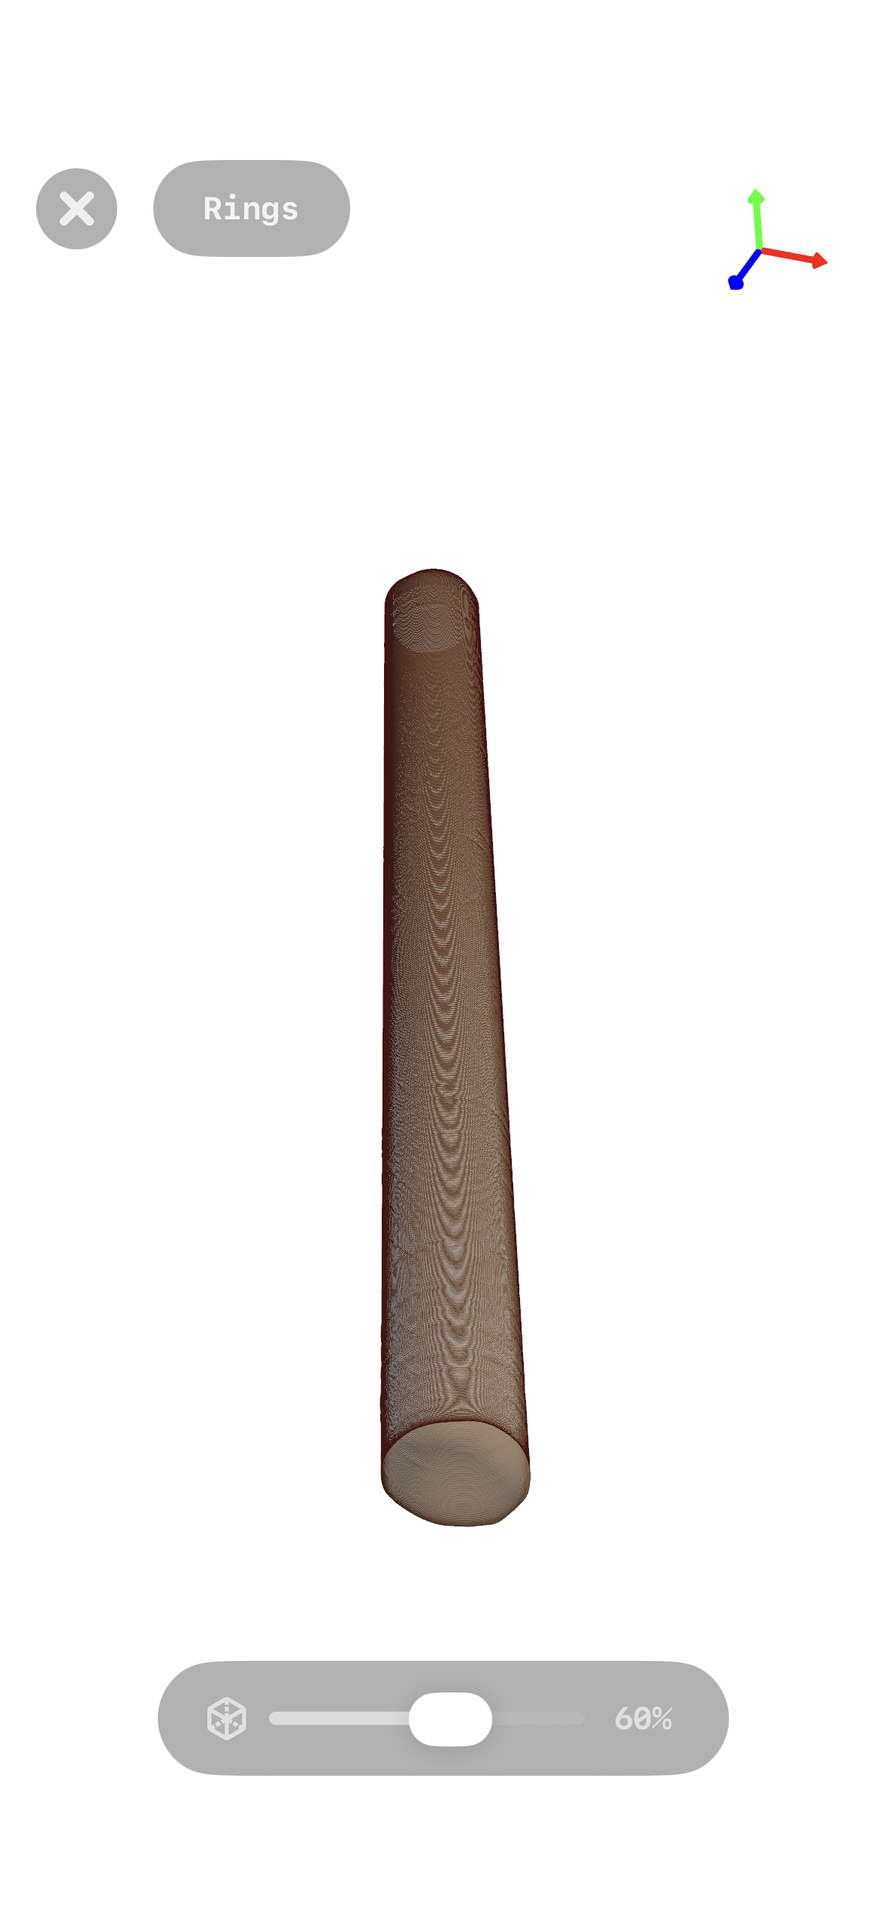
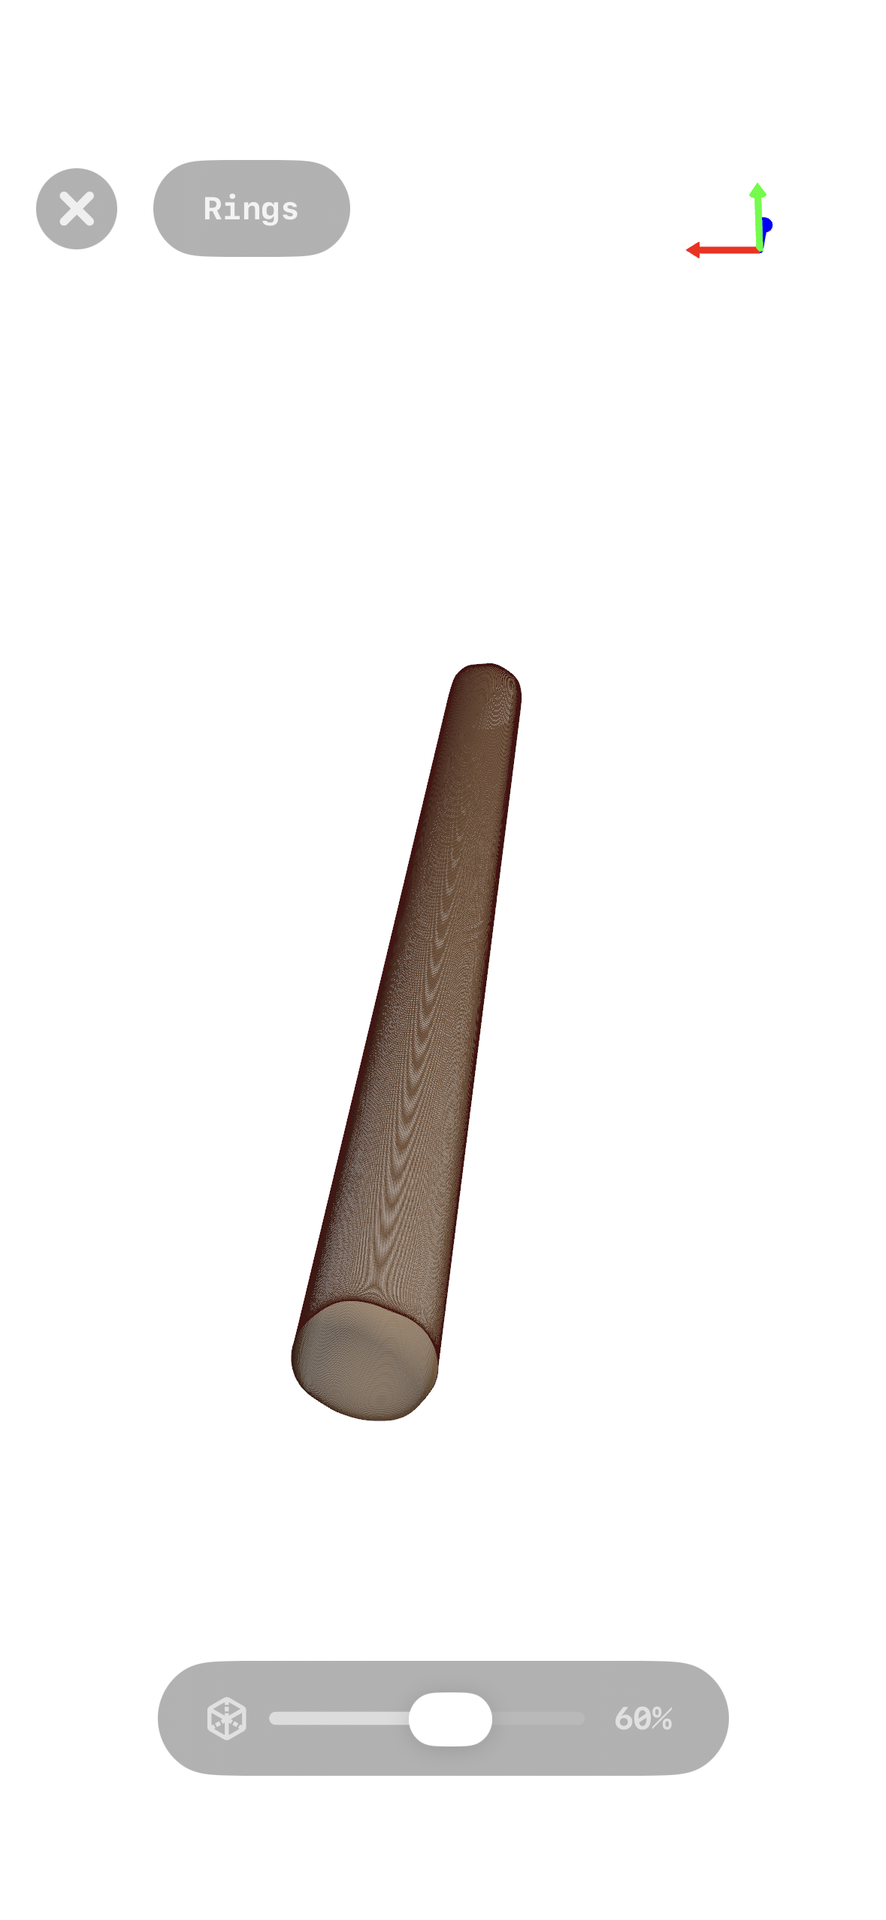
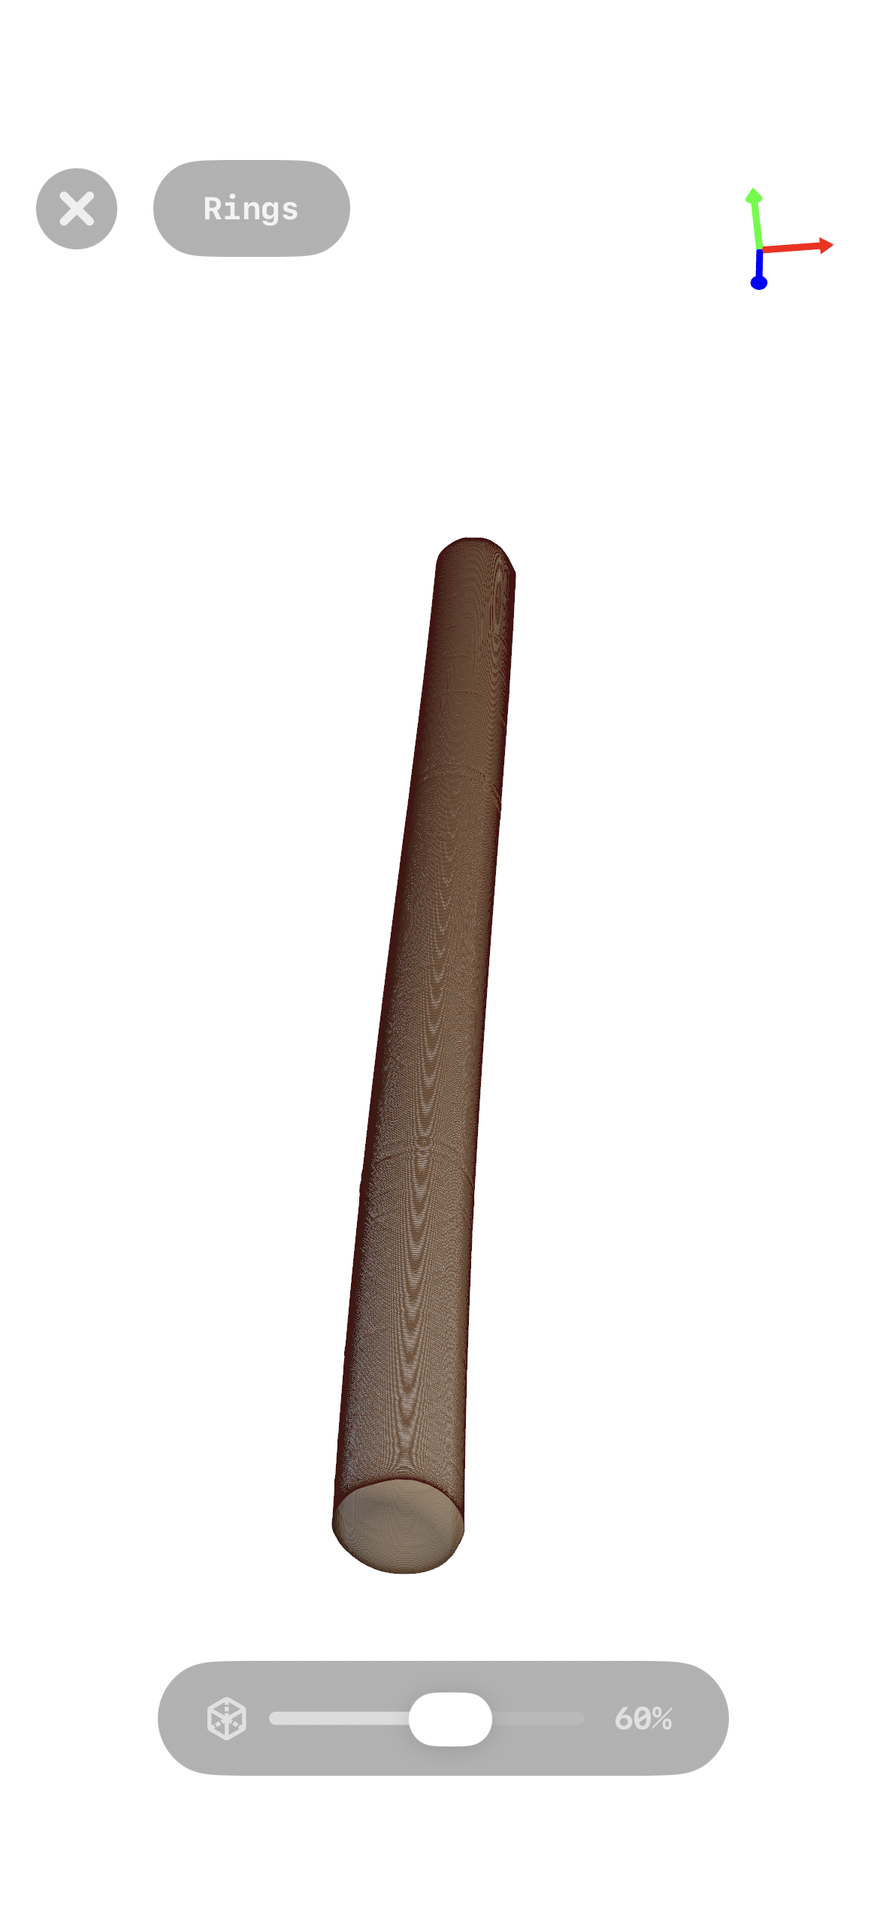
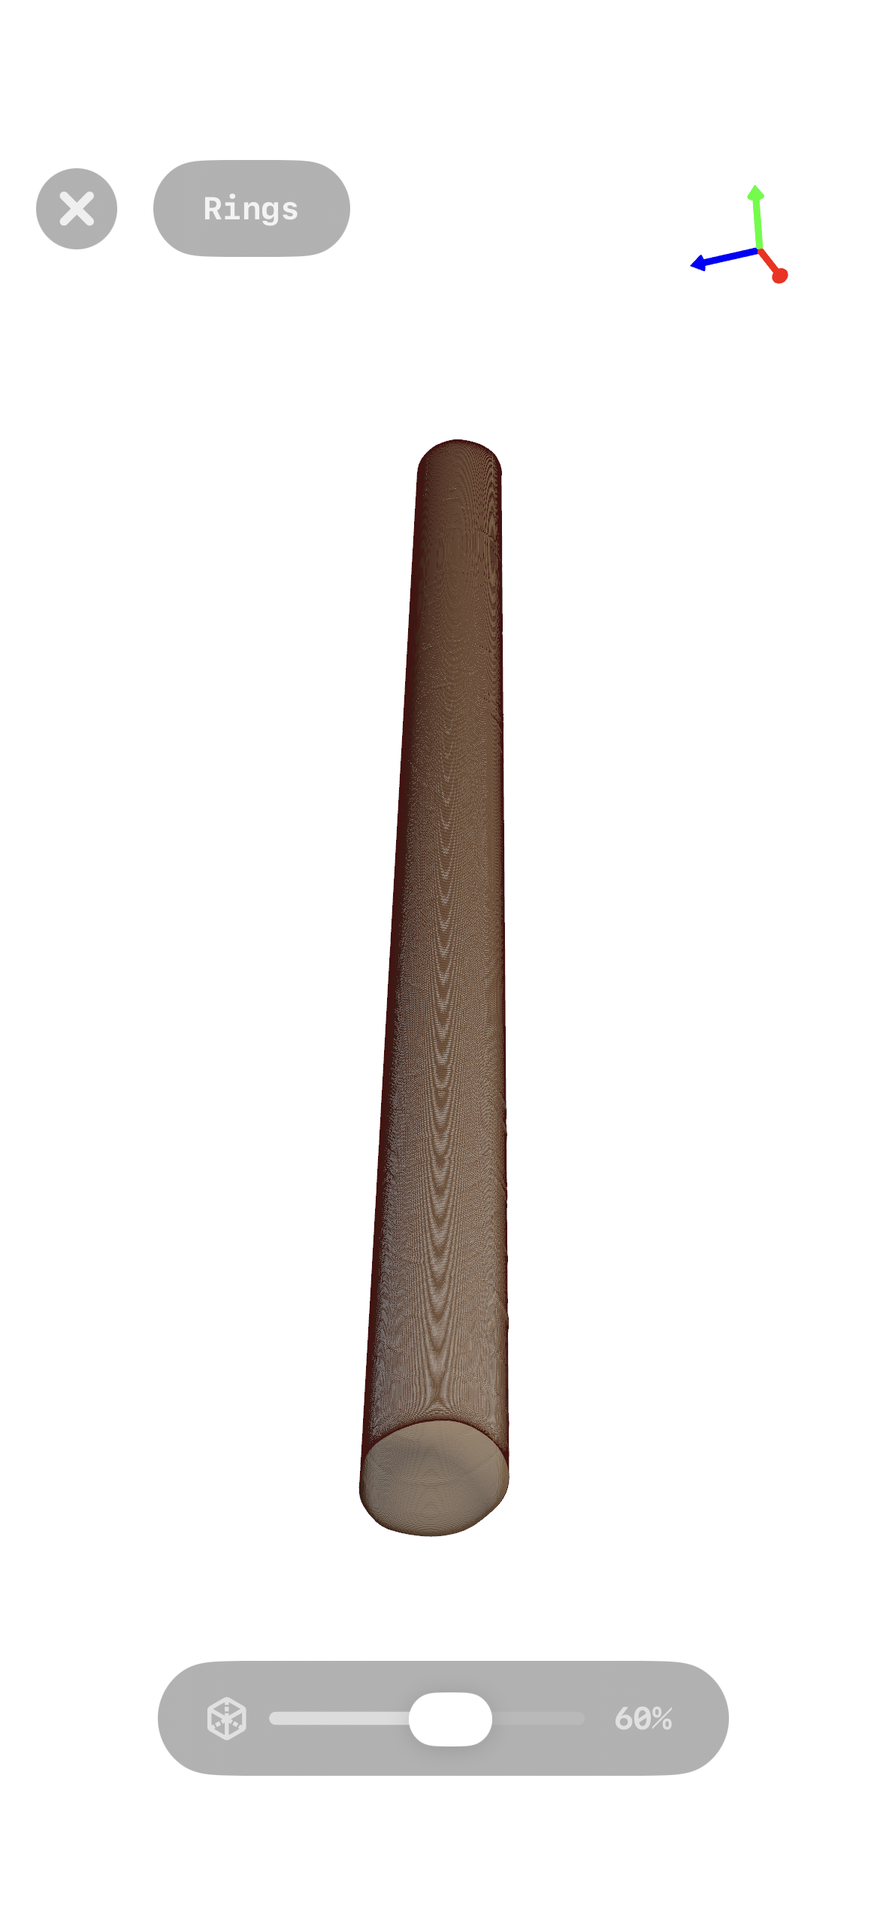
iPhone 15 Pro with LiDAR scanner. LogScanner v1.5 (build 29). No external hardware, no tripod, no calibration jig — just the phone in hand.
Logs
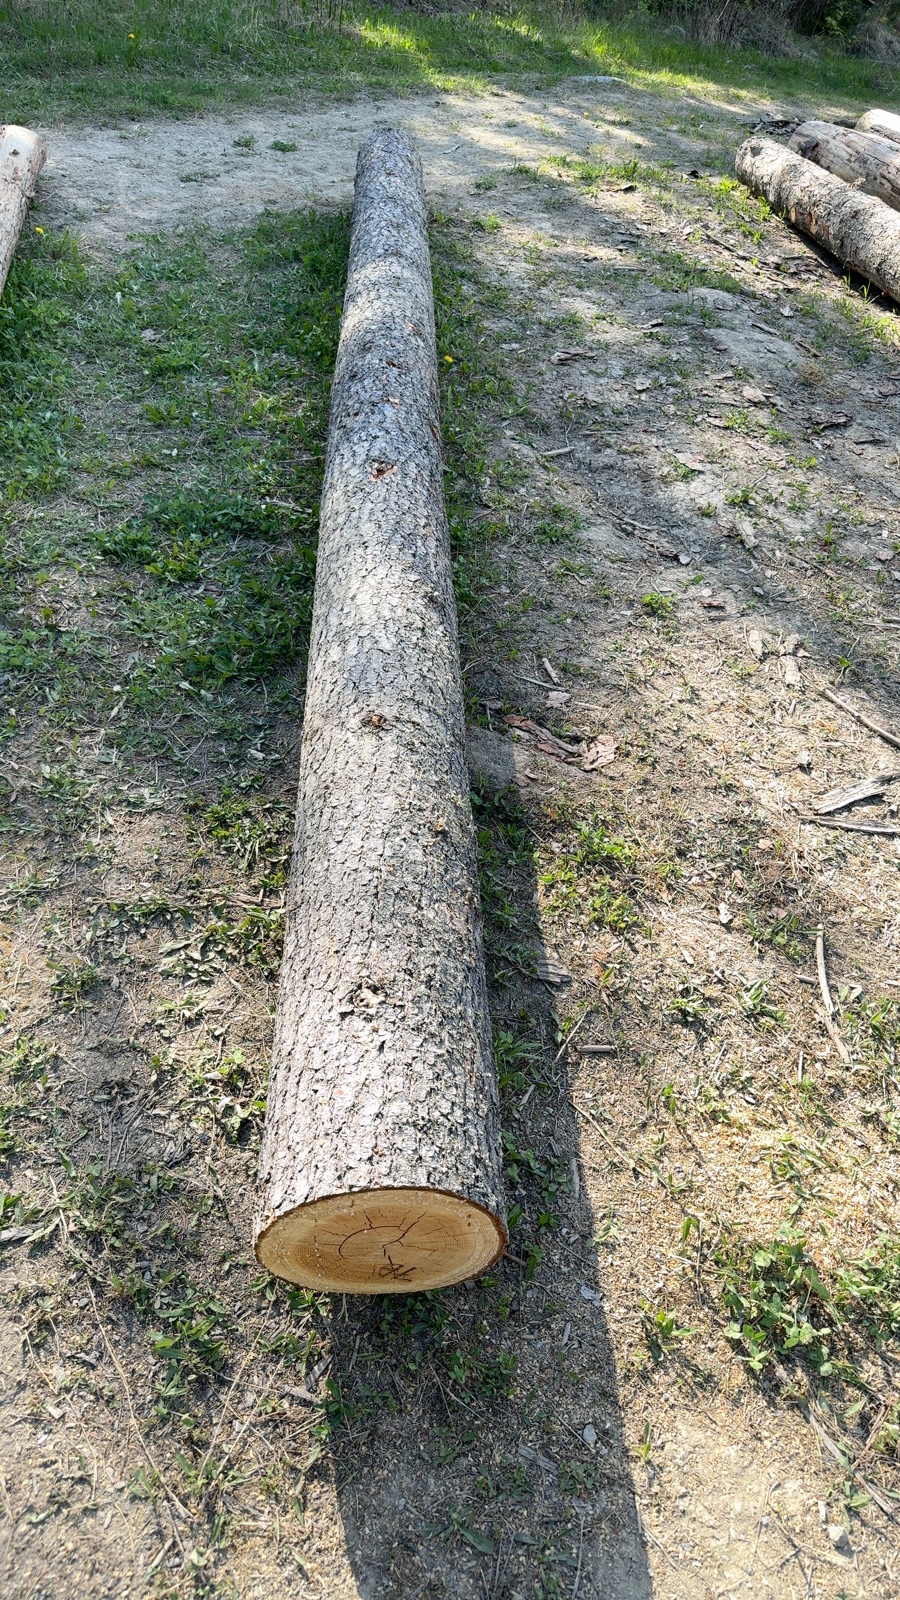
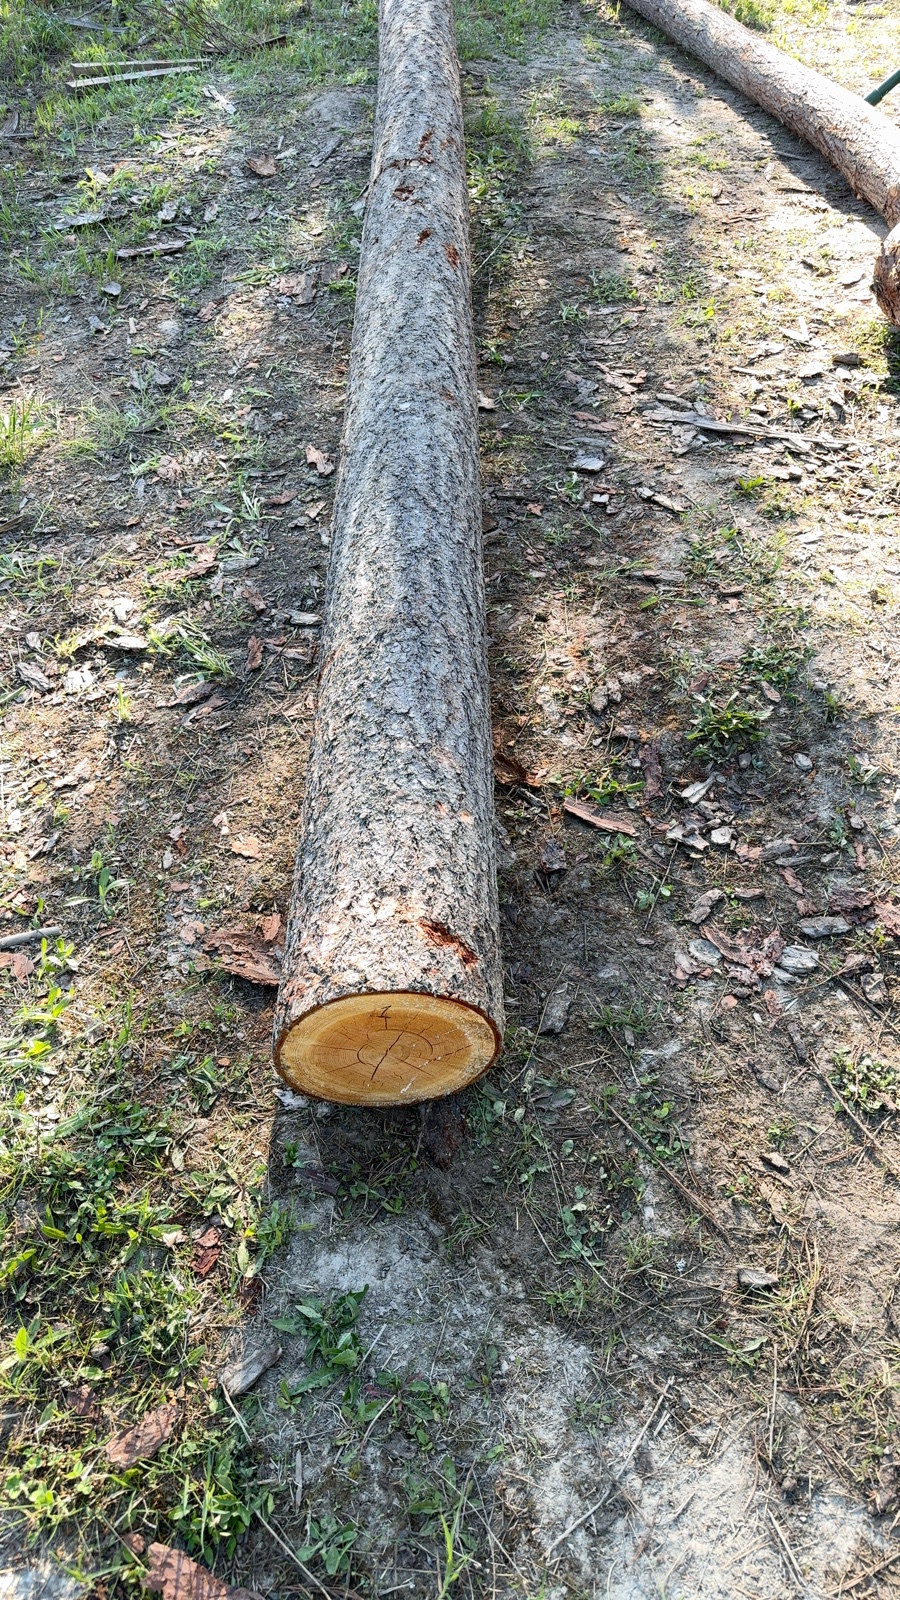
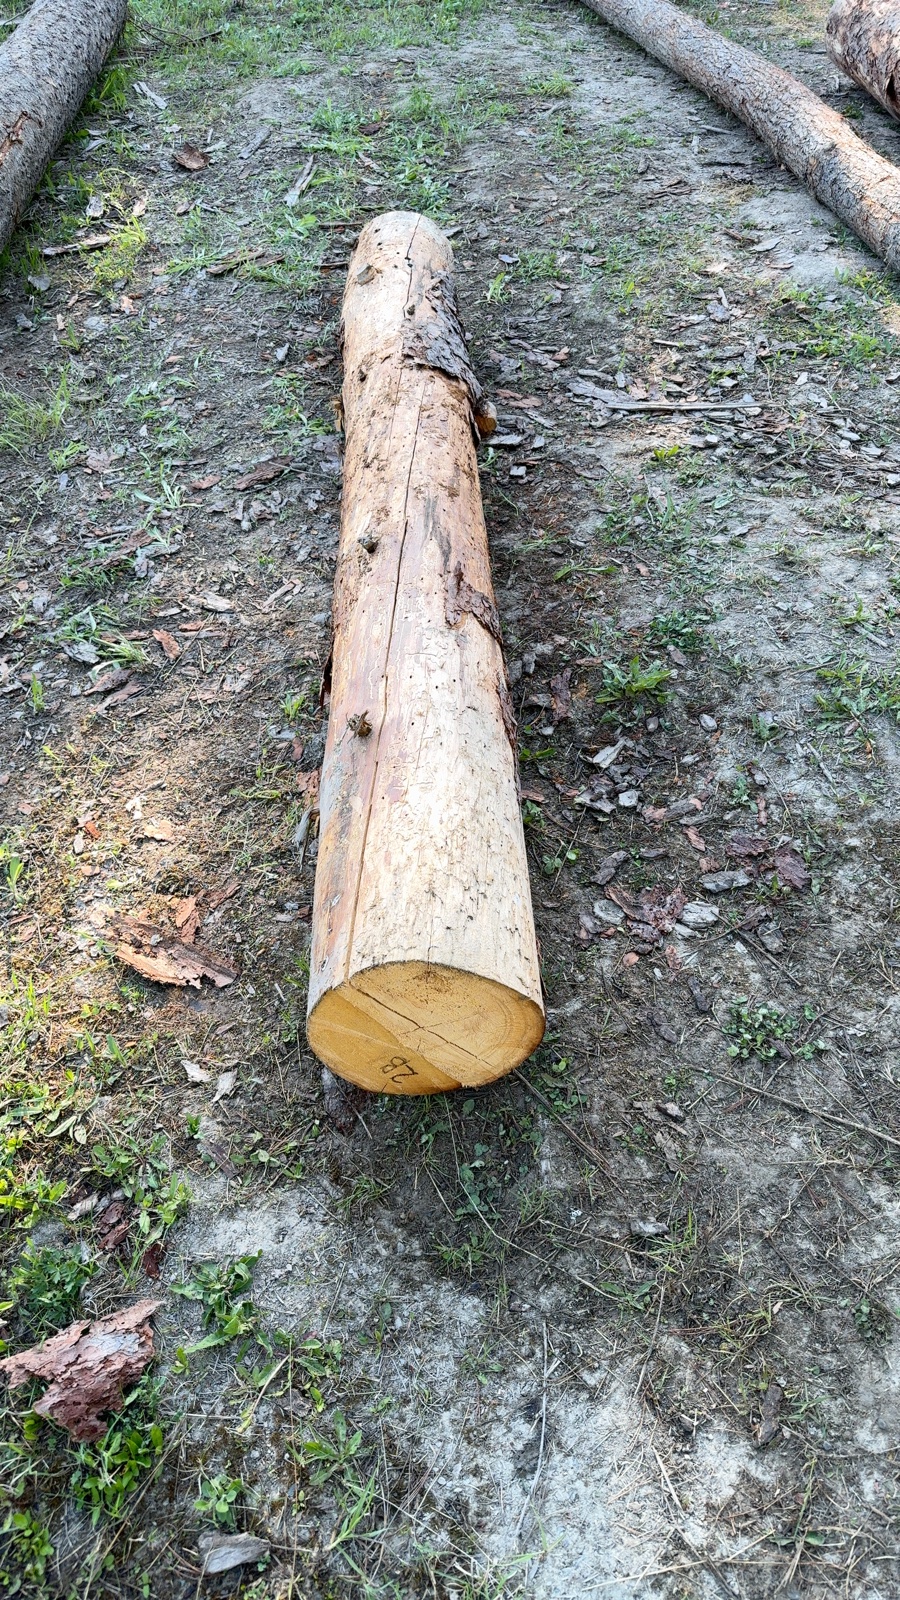
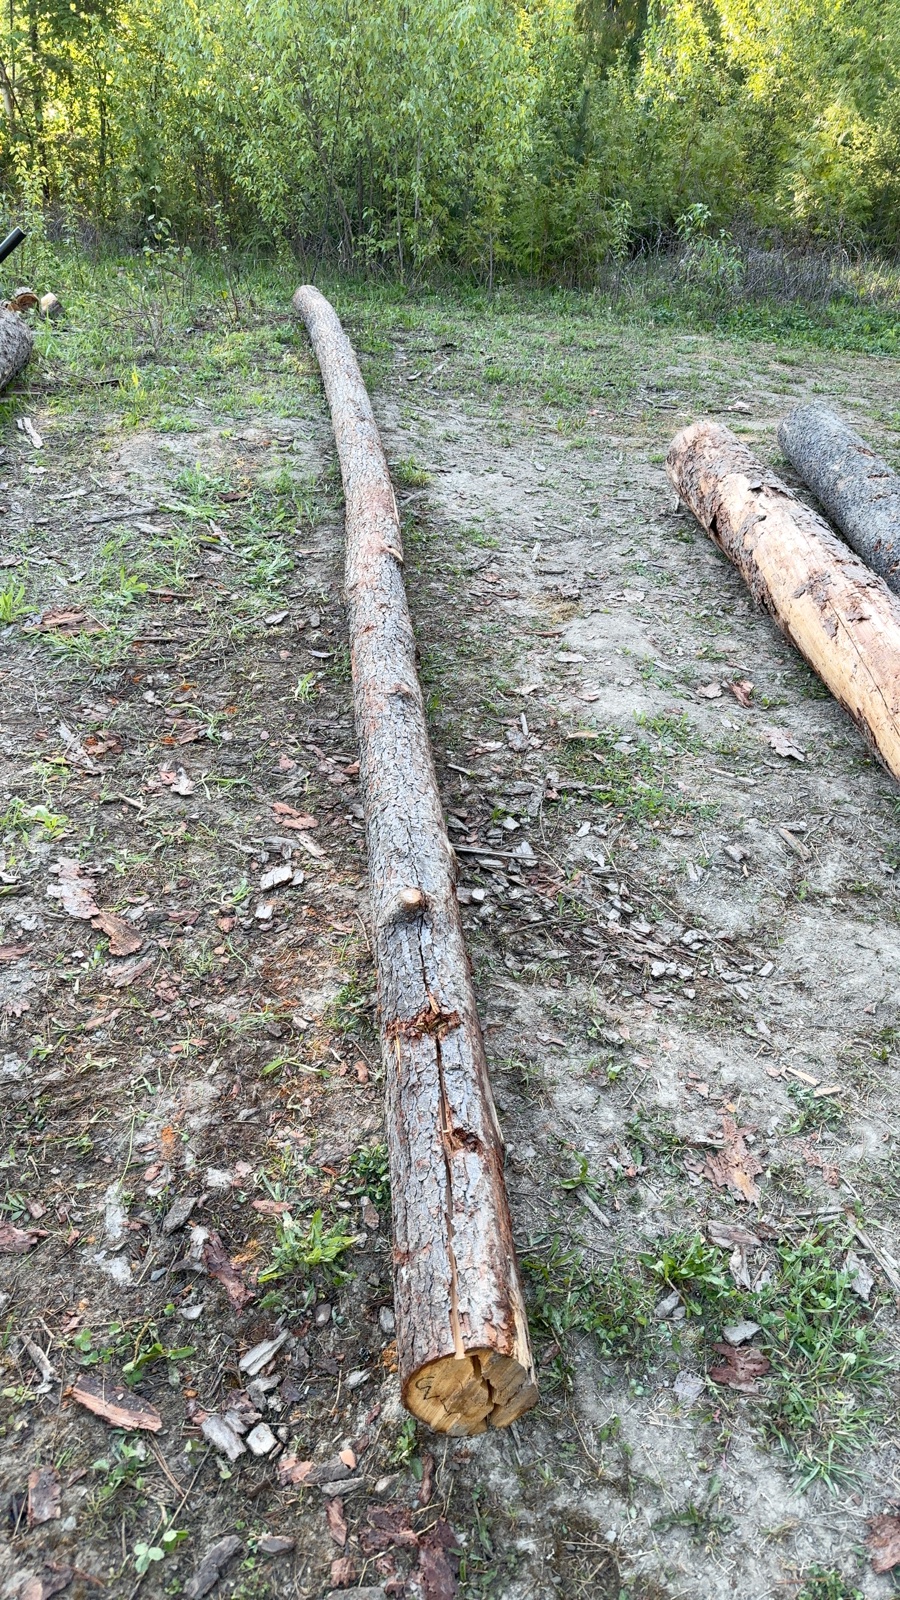
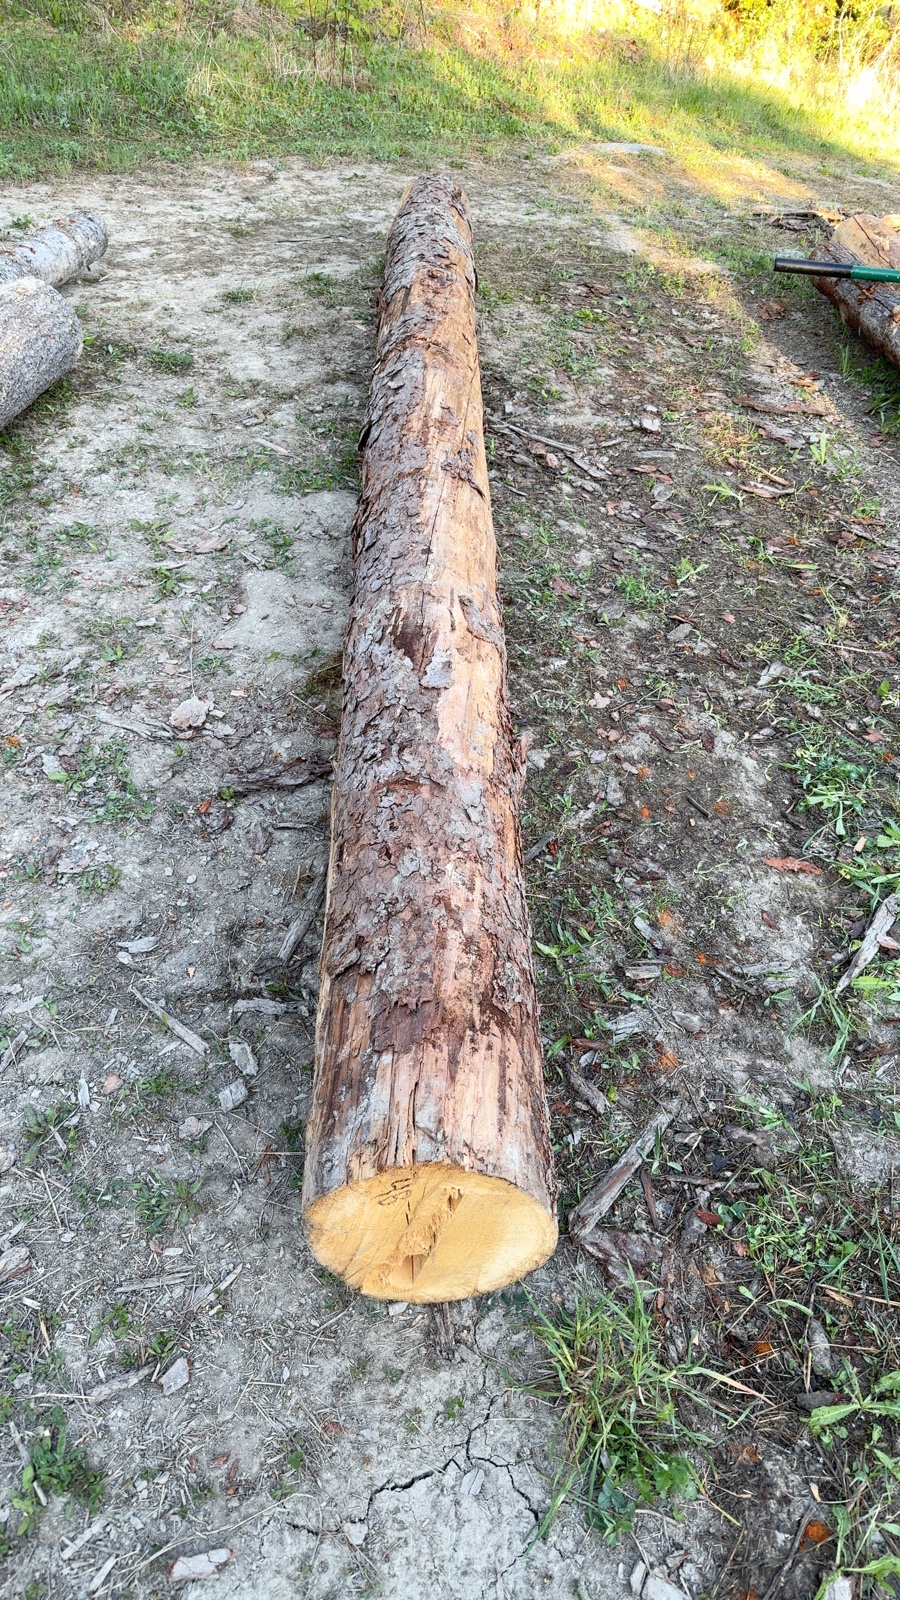
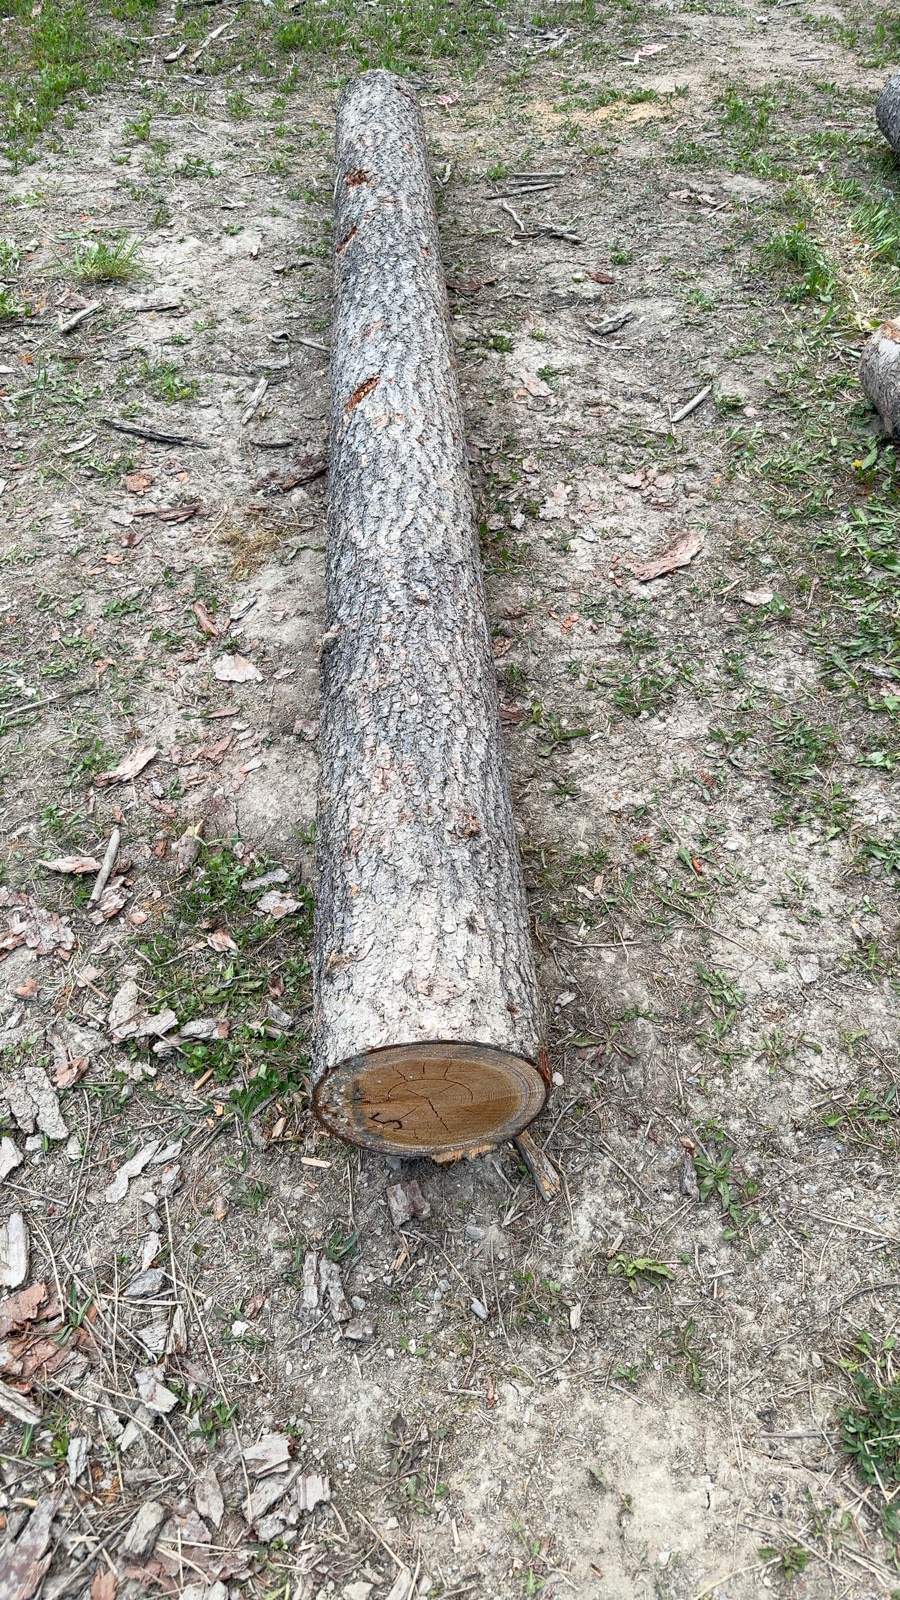
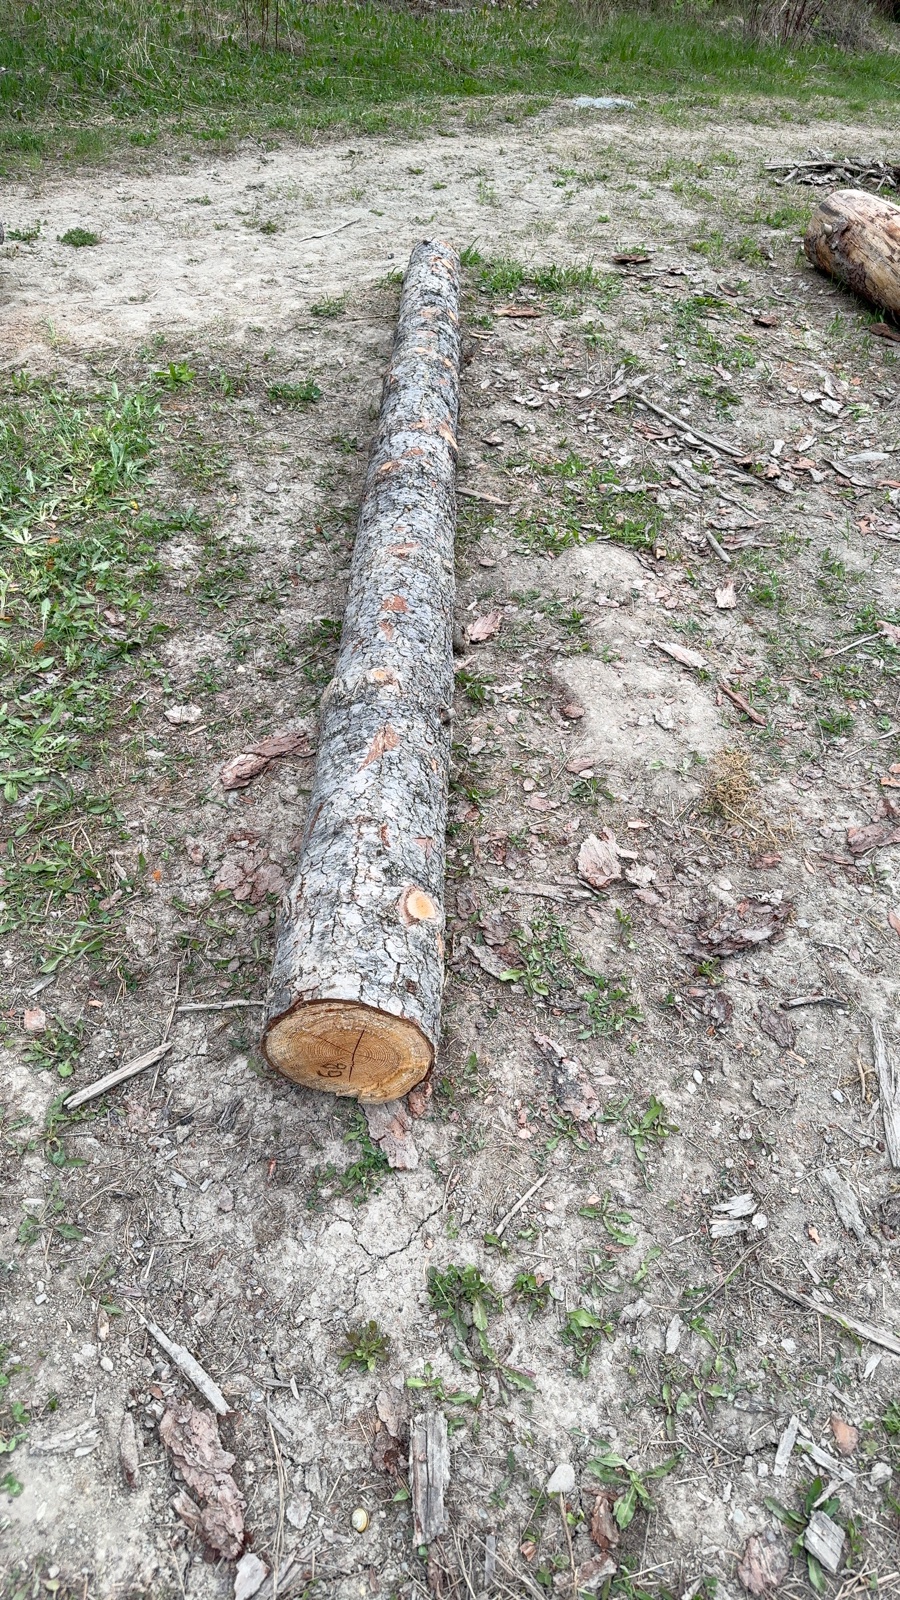
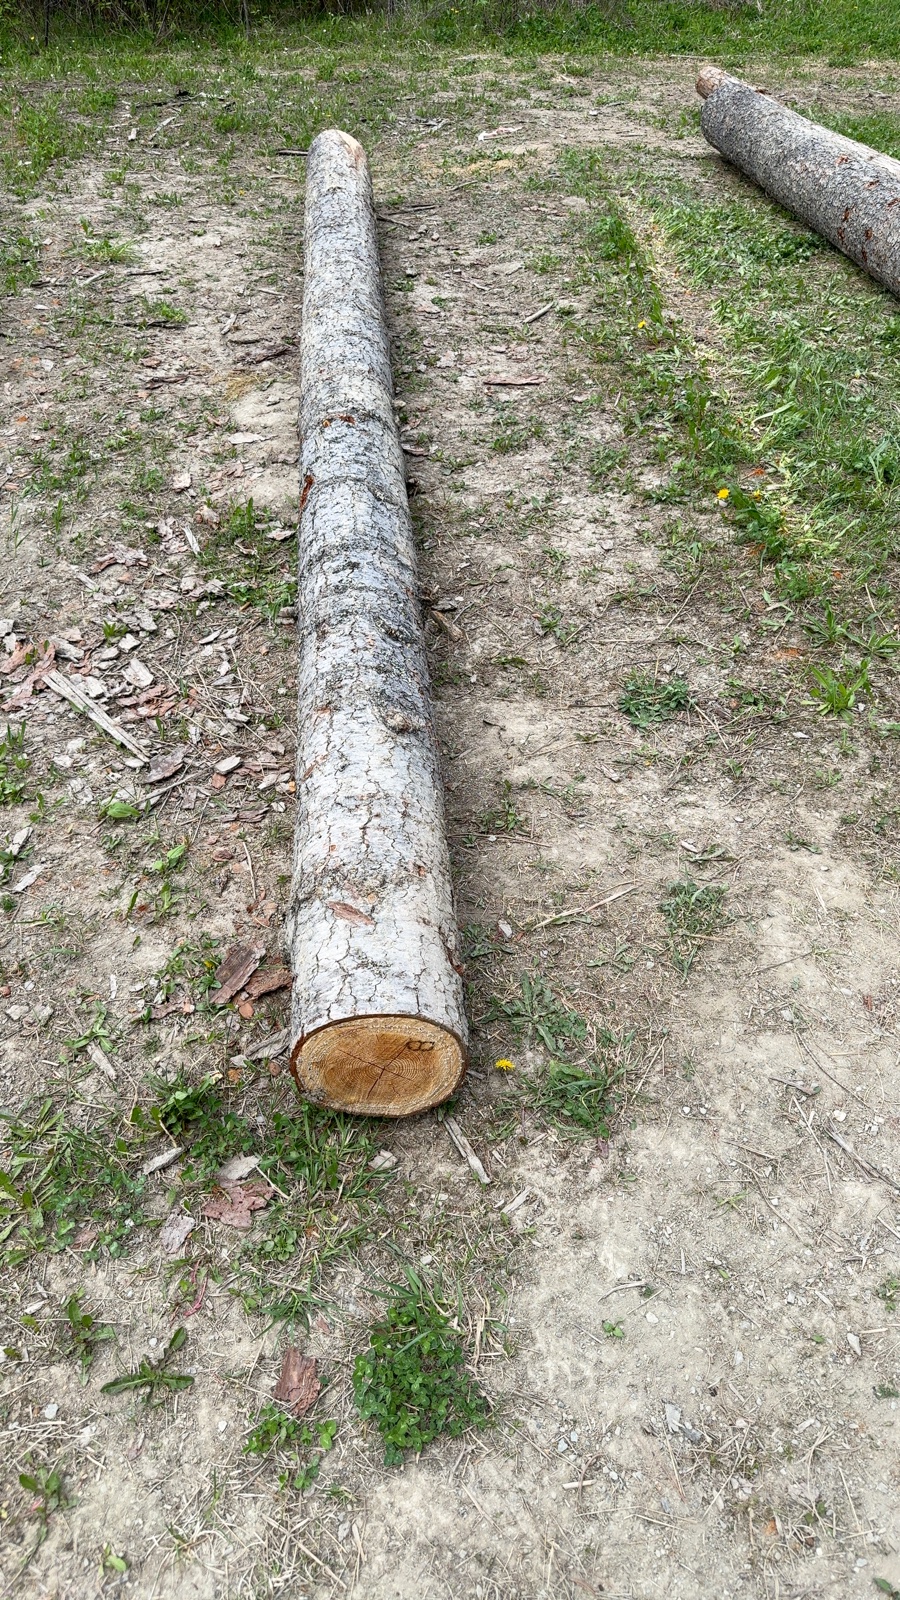
9 logs: 8 Douglas Fir and 1 Western Red Cedar. Lengths from 8.5 to 29.7 feet. Diameters from 6.7 to 14.4 inches. Real production logs, not test cylinders.
Ground Truth
Tape measurements for every log: overall length plus five circumference readings (both ends and three mid-points). Diameters calculated as circumference ÷ π.
Protocol
Each log scanned 10 times (9 scans for Log 9, 5 for Log 1). Walk around the log, capture both ends, let the app reconstruct. No cherry-picking — every scan is included.
Summary Results
Across 84 scans and 9 logs, here are the headline numbers:
vs Tape
Bias vs Tape
Repeatability (CV)
Repeatability (CV)
| Metric | Mean Bias vs Tape | Repeatability (CV) |
|---|---|---|
| Length | 0.70″ (0.46%) | 0.85% |
| Large-End Diameter | 0.24″ (2.1%) | 0.9% |
| Small-End Diameter | 0.39″ (4.0%) | 1.0% |
| Volume | — | 1.5% |
| Board Feet (Intl ¼″) | — | 2.4% |
Per-Log Results
Below is the complete data for each log. Every scan is shown — nothing is cherry-picked or excluded. The “Avg” row is the mean across all scans of that log.
Log 1 — Douglas Fir
Ground truth: 20’5″ length • 14.36″ large end • 12.53″ small end • 5 scans
| Scan # | Lg End | Sm End | Avg Dia | Volume | Length | Sweep | Board Feet |
|---|---|---|---|---|---|---|---|
| 1 | 13.83″ | 11.90″ | 12.85″ | 17.8 ft³ | 20’8″ | 2.6″ | 124.6 BF |
| 2 | 13.83″ | 11.71″ | 12.70″ | 17.4 ft³ | 20’5″ | 1.7″ | 120.4 BF |
| 3 | 13.69″ | 11.88″ | 12.72″ | 17.1 ft³ | 20’3″ | 2.2″ | 124.3 BF |
| 4 | 13.74″ | 11.81″ | 12.76″ | 17.2 ft³ | 20’3″ | 1.4″ | 122.7 BF |
| 5 | 13.83″ | 12.27″ | 12.96″ | 17.7 ft³ | 20’6″ | 0.8″ | 133.2 BF |
| Avg | 13.79″ | 11.91″ | 12.80″ | 17.4 ft³ | 20’5″ | 1.8″ | 125.0 BF |
vs Ground Truth: Length 0.00% • Lg Ø −4.0% • Sm Ø −4.9%
Log 2 — Douglas Fir
Ground truth: 8’7″ length • 12.10″ large end • 11.86″ small end • 10 scans
| Scan # | Lg End | Sm End | Avg Dia | Volume | Length | Sweep | Board Feet |
|---|---|---|---|---|---|---|---|
| 1 | 12.39″ | 12.18″ | 12.27″ | 6.6 ft³ | 8’5″ | 0.9″ | 45.6 BF |
| 2 | 12.44″ | 12.23″ | 12.31″ | 6.5 ft³ | 8’6″ | 0.8″ | 46.0 BF |
| 3 | 12.41″ | 12.11″ | 12.23″ | 6.4 ft³ | 8’4″ | 0.8″ | 44.9 BF |
| 4 | 12.39″ | 12.27″ | 12.30″ | 6.7 ft³ | 8’7″ | 0.9″ | 46.3 BF |
| 5 | 12.40″ | 12.13″ | 12.23″ | 6.5 ft³ | 8’5″ | 0.7″ | 45.1 BF |
| 6 | 12.41″ | 12.25″ | 12.31″ | 6.5 ft³ | 8’5″ | 0.7″ | 46.2 BF |
| 7 | 12.36″ | 12.10″ | 12.14″ | 6.5 ft³ | 8’6″ | 0.8″ | 44.9 BF |
| 8 | 12.40″ | 12.26″ | 12.31″ | 6.7 ft³ | 8’6″ | 0.8″ | 46.3 BF |
| 9 | 12.34″ | 12.25″ | 12.25″ | 6.5 ft³ | 8’6″ | 0.9″ | 46.2 BF |
| 10 | 12.42″ | 12.41″ | 12.40″ | 6.8 ft³ | 8’6″ | 0.8″ | 47.6 BF |
| Avg | 12.40″ | 12.22″ | 12.28″ | 6.6 ft³ | 8’6″ | 0.8″ | 45.9 BF |
vs Ground Truth: Length −1.4% • Lg Ø +2.5% • Sm Ø +3.1%
Log 3 — Douglas Fir
Ground truth: 29’8″ length • 9.71″ large end • 7.12″ small end • 10 scans
| Scan # | Lg End | Sm End | Avg Dia | Volume | Length | Sweep | Board Feet |
|---|---|---|---|---|---|---|---|
| 1 | 9.83″ | 6.75″ | 8.27″ | 9.9 ft³ | 29’7″ | 1.4″ | 62.6 BF |
| 2 | 9.80″ | 6.83″ | 8.28″ | 10.0 ft³ | 29’10″ | 2.8″ | 64.1 BF |
| 3 | 9.62″ | 6.95″ | 8.21″ | 9.8 ft³ | 29’5″ | 1.9″ | 66.5 BF |
| 4 | 9.90″ | 6.83″ | 8.30″ | 9.8 ft³ | 29’9″ | 2.4″ | 64.2 BF |
| 5 | 9.66″ | 6.83″ | 8.21″ | 9.9 ft³ | 29’9″ | 3.0″ | 64.2 BF |
| 6 | 9.91″ | 6.67″ | 8.26″ | 9.9 ft³ | 29’8″ | 3.1″ | 60.9 BF |
| 7 | 9.77″ | 6.73″ | 8.23″ | 9.9 ft³ | 29’9″ | 1.8″ | 62.2 BF |
| 8 | 9.97″ | 6.69″ | 8.29″ | 9.7 ft³ | 29’9″ | 2.1″ | 61.4 BF |
| 9 | 9.89″ | 6.74″ | 8.29″ | 9.9 ft³ | 29’10″ | 1.6″ | 62.4 BF |
| 10 | 9.77″ | 6.73″ | 8.21″ | 9.8 ft³ | 29’11″ | 4.2″ | 62.1 BF |
| Avg | 9.81″ | 6.78″ | 8.25″ | 9.9 ft³ | 29’9″ | 2.4″ | 63.1 BF |
vs Ground Truth: Length +0.1% • Lg Ø +1.1% • Sm Ø −4.9%
Log 4 — Douglas Fir
Ground truth: 14’10″ length • 13.77″ large end • 12.41″ small end • 10 scans
| Scan # | Lg End | Sm End | Avg Dia | Volume | Length | Sweep | Board Feet |
|---|---|---|---|---|---|---|---|
| 1 | 13.26″ | 12.27″ | 12.65″ | 12.7 ft³ | 14’10″ | 1.8″ | 87.0 BF |
| 2 | 13.83″ | 12.29″ | 12.85″ | 12.5 ft³ | 14’8″ | 1.4″ | 87.3 BF |
| 3 | 13.54″ | 12.12″ | 12.70″ | 12.2 ft³ | 14’8″ | 1.2″ | 84.6 BF |
| 4 | 13.12″ | 12.51″ | 12.66″ | 12.3 ft³ | 14’8″ | 0.7″ | 90.8 BF |
| 5 | 13.92″ | 12.29″ | 12.95″ | 12.5 ft³ | 14’6″ | 1.1″ | 87.3 BF |
| 6 | 13.95″ | 12.35″ | 13.03″ | 12.8 ft³ | 14’9″ | 1.4″ | 88.3 BF |
| 7 | 13.97″ | 12.32″ | 13.02″ | 12.5 ft³ | 14’5″ | 1.5″ | 87.8 BF |
| 8 | 13.96″ | 12.23″ | 12.92″ | 12.5 ft³ | 14’7″ | 0.7″ | 86.4 BF |
| 9 | 13.79″ | 12.27″ | 12.85″ | 12.6 ft³ | 14’9″ | 1.2″ | 87.1 BF |
| 10 | 13.72″ | 12.24″ | 12.79″ | 12.4 ft³ | 14’9″ | 1.1″ | 86.5 BF |
| Avg | 13.71″ | 12.29″ | 12.84″ | 12.5 ft³ | 14’8″ | 1.2″ | 87.3 BF |
vs Ground Truth: Length −0.9% • Lg Ø −0.4% • Sm Ø −1.0%
Log 5 — Douglas Fir
Ground truth: 12’5″ length • 12.18″ large end • 11.78″ small end • 10 scans
| Scan # | Lg End | Sm End | Avg Dia | Volume | Length | Sweep | Board Feet |
|---|---|---|---|---|---|---|---|
| 1 | 12.09″ | 11.18″ | 11.63″ | 8.7 ft³ | 12’4″ | 0.4″ | 59.1 BF |
| 2 | 11.86″ | 11.20″ | 11.51″ | 8.8 ft³ | 12’9″ | 0.6″ | 59.3 BF |
| 3 | 11.97″ | 11.27″ | 11.58″ | 8.9 ft³ | 12’7″ | 0.8″ | 60.1 BF |
| 4 | 11.88″ | 11.28″ | 11.56″ | 8.8 ft³ | 12’8″ | 0.5″ | 60.3 BF |
| 5 | 12.02″ | 11.25″ | 11.55″ | 8.8 ft³ | 12’5″ | 0.3″ | 59.8 BF |
| 6 | 11.98″ | 11.28″ | 11.60″ | 8.9 ft³ | 12’7″ | 0.6″ | 60.2 BF |
| 7 | 12.03″ | 11.32″ | 11.66″ | 8.8 ft³ | 12’4″ | 0.3″ | 60.8 BF |
| 8 | 12.05″ | 11.09″ | 11.56″ | 8.8 ft³ | 12’7″ | 0.4″ | 58.0 BF |
| 9 | 12.03″ | 11.32″ | 11.65″ | 8.7 ft³ | 12’4″ | 0.4″ | 60.8 BF |
| 10 | 12.03″ | 11.28″ | 11.60″ | 8.9 ft³ | 12’8″ | 1.0″ | 60.3 BF |
| Avg | 11.99″ | 11.25″ | 11.59″ | 8.8 ft³ | 12’6″ | 0.5″ | 59.9 BF |
vs Ground Truth: Length +0.9% • Lg Ø −1.5% • Sm Ø −4.5%
Log 6 — Douglas Fir
Ground truth: 10’5″ length • 9.23″ large end • 7.24″ small end • 10 scans
| Scan # | Lg End | Sm End | Avg Dia | Volume | Length | Sweep | Board Feet |
|---|---|---|---|---|---|---|---|
| 1 | 8.95″ | 6.76″ | 7.84″ | 3.3 ft³ | 10’6″ | 0.5″ | 13.9 BF |
| 2 | 8.92″ | 6.76″ | 7.83″ | 3.2 ft³ | 10’6″ | 0.6″ | 13.9 BF |
| 3 | 9.04″ | 6.72″ | 7.85″ | 3.2 ft³ | 10’6″ | 0.3″ | 13.7 BF |
| 4 | 8.86″ | 6.76″ | 7.77″ | 3.1 ft³ | 10’4″ | 0.4″ | 13.9 BF |
| 5 | 8.94″ | 6.79″ | 7.83″ | 3.3 ft³ | 10’5″ | 0.4″ | 14.1 BF |
| 6 | 8.99″ | 6.76″ | 7.83″ | 3.3 ft³ | 10’6″ | 0.4″ | 13.9 BF |
| 7 | 8.85″ | 6.80″ | 7.72″ | 3.2 ft³ | 10’7″ | 0.4″ | 14.1 BF |
| 8 | 9.08″ | 6.82″ | 7.89″ | 3.3 ft³ | 10’4″ | 0.4″ | 14.2 BF |
| 9 | 9.02″ | 6.78″ | 7.85″ | 3.3 ft³ | 10’5″ | 0.4″ | 14.0 BF |
| 10 | 9.00″ | 6.78″ | 7.86″ | 3.3 ft³ | 10’5″ | 0.4″ | 14.0 BF |
| Avg | 8.97″ | 6.77″ | 7.83″ | 3.3 ft³ | 10’5″ | 0.4″ | 14.0 BF |
vs Ground Truth: Length +0.3% • Lg Ø −2.9% • Sm Ø −6.5%
Log 7 — Douglas Fir
Ground truth: 16’4″ length • 11.62″ large end • 11.22″ small end • 10 scans
| Scan # | Lg End | Sm End | Avg Dia | Volume | Length | Sweep | Board Feet |
|---|---|---|---|---|---|---|---|
| 1 | 11.50″ | 10.54″ | 11.01″ | 10.5 ft³ | 16’6″ | 0.9″ | 72.7 BF |
| 2 | 11.35″ | 10.37″ | 10.85″ | 10.2 ft³ | 16’4″ | 0.5″ | 70.1 BF |
| 3 | 11.27″ | 10.57″ | 10.92″ | 10.1 ft³ | 16’2″ | 0.8″ | 73.2 BF |
| 4 | 11.38″ | 10.52″ | 10.94″ | 10.3 ft³ | 16’2″ | 0.8″ | 72.5 BF |
| 5 | 11.44″ | 10.70″ | 11.05″ | 10.3 ft³ | 16’3″ | 0.6″ | 75.2 BF |
| 6 | 11.20″ | 10.56″ | 10.86″ | 10.1 ft³ | 16’3″ | 0.6″ | 73.1 BF |
| 7 | 11.51″ | 10.38″ | 10.94″ | 10.2 ft³ | 16’4″ | 0.9″ | 70.4 BF |
| 8 | 11.39″ | 10.44″ | 10.90″ | 10.0 ft³ | 16’1″ | 1.3″ | 71.2 BF |
| 9 | 11.50″ | 10.48″ | 10.98″ | 10.3 ft³ | 16’5″ | 1.1″ | 71.8 BF |
| 10 | 11.23″ | 10.50″ | 10.85″ | 10.3 ft³ | 16’5″ | 0.3″ | 72.0 BF |
| Avg | 11.38″ | 10.51″ | 10.93″ | 10.2 ft³ | 16’4″ | 0.8″ | 72.2 BF |
vs Ground Truth: Length 0.0% • Lg Ø −2.1% • Sm Ø −6.4%
Log 8 — Douglas Fir
Ground truth: 16’6″ length • 10.98″ large end • 9.03″ small end • 10 scans
| Scan # | Lg End | Sm End | Avg Dia | Volume | Length | Sweep | Board Feet |
|---|---|---|---|---|---|---|---|
| 1 | 10.69″ | 9.00″ | 9.83″ | 8.0 ft³ | 16’4″ | 0.5″ | 50.9 BF |
| 2 | 10.81″ | 8.94″ | 9.86″ | 8.0 ft³ | 16’5″ | 0.4″ | 50.1 BF |
| 3 | 10.73″ | 8.98″ | 9.84″ | 8.1 ft³ | 16’7″ | 0.8″ | 50.7 BF |
| 4 | 10.71″ | 8.84″ | 9.76″ | 7.9 ft³ | 16’6″ | 1.3″ | 48.8 BF |
| 5 | 10.74″ | 8.97″ | 9.84″ | 8.2 ft³ | 16’7″ | 2.4″ | 50.4 BF |
| 6 | 10.65″ | 9.04″ | 9.83″ | 8.2 ft³ | 16’7″ | 0.7″ | 51.4 BF |
| 7 | 10.78″ | 9.12″ | 9.93″ | 8.1 ft³ | 16’5″ | 0.6″ | 52.4 BF |
| 8 | 10.88″ | 8.98″ | 9.92″ | 8.0 ft³ | 16’5″ | 0.5″ | 50.7 BF |
| 9 | 10.68″ | 9.07″ | 9.86″ | 7.8 ft³ | 15’12″ | 1.0″ | 47.8 BF |
| 10 | 10.76″ | 9.11″ | 9.92″ | 8.3 ft³ | 16’8″ | 1.4″ | 52.4 BF |
| Avg | 10.74″ | 9.01″ | 9.86″ | 8.1 ft³ | 16’5″ | 1.0″ | 50.6 BF |
vs Ground Truth: Length −0.3% • Lg Ø −2.2% • Sm Ø −0.3%
Log 9 — Western Red Cedar
Ground truth: 20’8″ length • 8.68″ large end • 6.68″ small end • 9 scans
| Scan # | Lg End | Sm End | Avg Dia | Volume | Length | Sweep | Board Feet |
|---|---|---|---|---|---|---|---|
| 1 | 8.72″ | 6.26″ | 7.47″ | 5.8 ft³ | 20’6″ | 1.6″ | 29.7 BF |
| 2 | 8.80″ | 6.24″ | 7.45″ | 5.8 ft³ | 20’9″ | 1.7″ | 29.4 BF |
| 3 | 8.82″ | 6.21″ | 7.44″ | 5.9 ft³ | 20’9″ | 1.3″ | 29.1 BF |
| 4 | 9.05″ | 6.41″ | 7.69″ | 6.0 ft³ | 20’7″ | 1.3″ | 31.4 BF |
| 5 | 8.92″ | 6.46″ | 7.62″ | 6.0 ft³ | 20’8″ | 2.6″ | 31.9 BF |
| 6 | 8.88″ | 6.48″ | 7.59″ | 5.9 ft³ | 20’10″ | 2.7″ | 32.2 BF |
| 7 | 8.88″ | 6.45″ | 7.63″ | 5.9 ft³ | 20’8″ | 1.6″ | 31.8 BF |
| 8 | 8.81″ | 6.37″ | 7.54″ | 5.8 ft³ | 20’9″ | 0.9″ | 30.8 BF |
| 9 | 8.79″ | 6.38″ | 7.55″ | 6.0 ft³ | 20’11″ | 1.9″ | 31.0 BF |
| Avg | 8.85″ | 6.36″ | 7.55″ | 5.9 ft³ | 20’9″ | 1.7″ | 30.8 BF |
vs Ground Truth: Length +0.2% • Lg Ø +2.0% • Sm Ø −4.8%
Accuracy vs Tape: All 9 Logs
The table below compares LogScanner’s average measurement (across all scans of each log) against the tape ground truth.
| Log | Species | GT Length | Scanner Length | Δ% | GT Lg Ø | Scanner Lg Ø | Δ% | GT Sm Ø | Scanner Sm Ø | Δ% |
|---|---|---|---|---|---|---|---|---|---|---|
| 1 | Doug Fir | 245.0″ | 245.0″ | 0.0% | 14.36″ | 13.79″ | −4.0% | 12.53″ | 11.91″ | −4.9% |
| 2 | Doug Fir | 103.0″ | 101.6″ | −1.4% | 12.10″ | 12.40″ | +2.5% | 11.86″ | 12.22″ | +3.1% |
| 3 | Doug Fir | 356.2″ | 356.7″ | +0.1% | 9.71″ | 9.81″ | +1.1% | 7.12″ | 6.78″ | −4.9% |
| 4 | Doug Fir | 177.5″ | 175.9″ | −0.9% | 13.77″ | 13.71″ | −0.4% | 12.41″ | 12.29″ | −1.0% |
| 5 | Doug Fir | 149.0″ | 150.3″ | +0.9% | 12.18″ | 11.99″ | −1.5% | 11.78″ | 11.25″ | −4.5% |
| 6 | Doug Fir | 125.0″ | 125.4″ | +0.3% | 9.23″ | 8.97″ | −2.9% | 7.24″ | 6.77″ | −6.5% |
| 7 | Doug Fir | 195.5″ | 195.5″ | 0.0% | 11.62″ | 11.38″ | −2.1% | 11.22″ | 10.51″ | −6.4% |
| 8 | Doug Fir | 198.0″ | 197.4″ | −0.3% | 10.98″ | 10.74″ | −2.2% | 9.03″ | 9.01″ | −0.3% |
| 9 | Cedar | 248.0″ | 248.6″ | +0.2% | 8.68″ | 8.85″ | +2.0% | 6.68″ | 6.36″ | −4.8% |
What the Numbers Mean
Length is effectively dead-on
Every log measured within 1.4% of the tape. Five of nine logs were within half a percent. Two logs (Log 1 and Log 7) hit the tape measurement exactly. For a handheld phone scanner with no calibration fixtures, this is remarkable.
Diameter is consistent, with a known offset
Large-end diameters average 2.1% below tape. Small-end diameters show a more consistent 4–6% negative bias. As noted above, this is driven by the boundary methodology: the operator set end-face boundaries to the inside-of-bark wood line, while the tape measured the outside circumference including bark. The critical finding is that this offset is uniform — it doesn’t flip signs or vary wildly between logs. A uniform offset can be corrected with a single calibration factor; a random one cannot.
Repeatability is the real story
Scan the same log ten times, get the same answer ten times. That’s the core promise of any measurement tool, and it’s where LogScanner delivers most convincingly:
- Length CV: 0.85% — a 16-foot log varies by about 1.6 inches scan-to-scan
- Diameter CV: 0.9% — a 12-inch log varies by about 0.1 inches
- Volume CV: 1.5% — volume, which compounds length and diameter errors, still stays tight
- Board feet CV: 2.4% — the final output a mill cares about, within practical tolerance
Log 3: the stress test
Log 3 was the longest log in the test at nearly 30 feet — a challenging scan requiring more walking and more LiDAR frames. Despite this, length accuracy was +0.1% (essentially perfect), large-end diameter was +1.1%, and volume CV was 0.9% — the tightest of all nine logs. Longer logs actually give the algorithm more data to work with.
Methodology Notes
- Log 1 has 5 scans (not 10) and Log 9 has 9 scans due to field conditions. All other logs have the full 10.
- No scans were excluded. Every scan that was captured is in the data. The worst individual scan across the entire corpus was Log 8, Scan 9, which measured 15’12″ (191.9″) vs the 198″ tape — a 3.1% miss. It’s in the table.
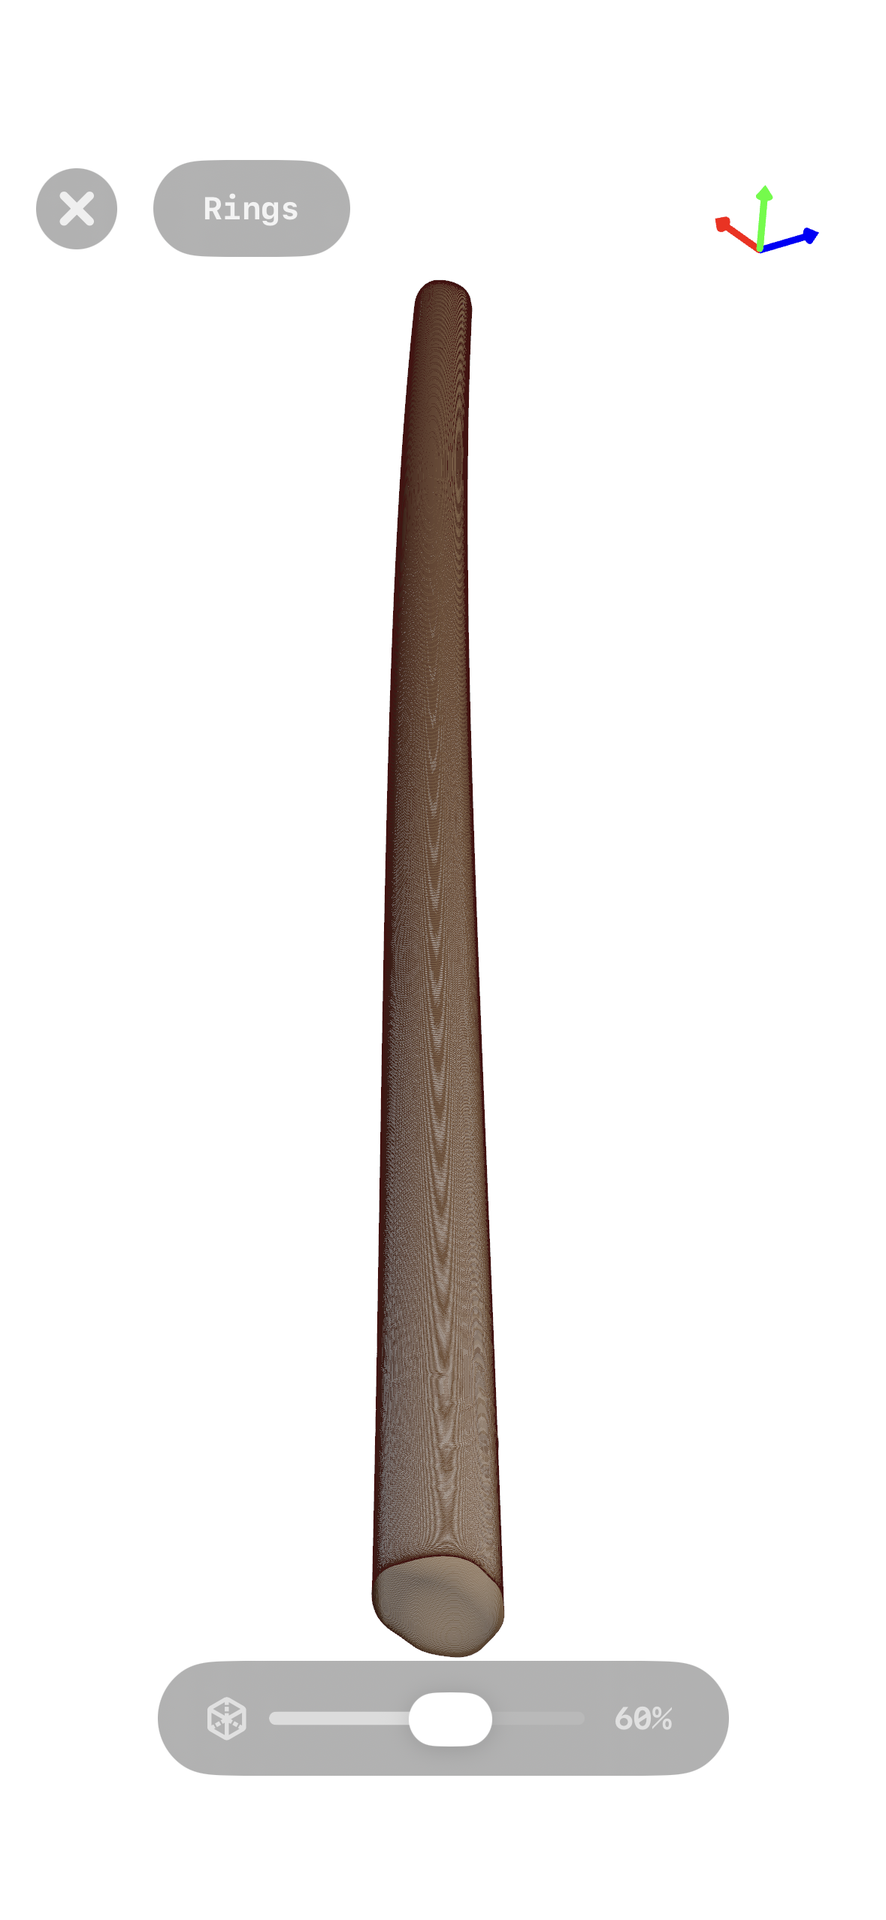
- End-face boundaries were manually verified. After scanning, the operator reviewed and adjusted the automatic boundary detection on each end face to align with the inside-of-bark wood line. This is a standard step in the LogScanner workflow.
- All scans used the same device and operator. Multi-operator and multi-device testing is planned for a future study.
What’s Next
This test establishes a baseline. We now have a repeatable benchmark corpus that any future algorithm change must beat. Specific areas of active development:
- Sweep measurement — currently the noisiest metric (CV up to 64% on some logs). An adaptive algorithm already in testing reduces this by 67–75%.
- Bark thickness calibration — allowing operators to specify an expected bark thickness to bridge the inside-bark/outside-bark gap.
- Multi-operator validation — testing with multiple users to quantify operator-dependent variation.