Manual › Log Master › Getting around Log Master
Getting around Log Master
The layout of the optimizer screen, and what each control does.
The optimizer screen
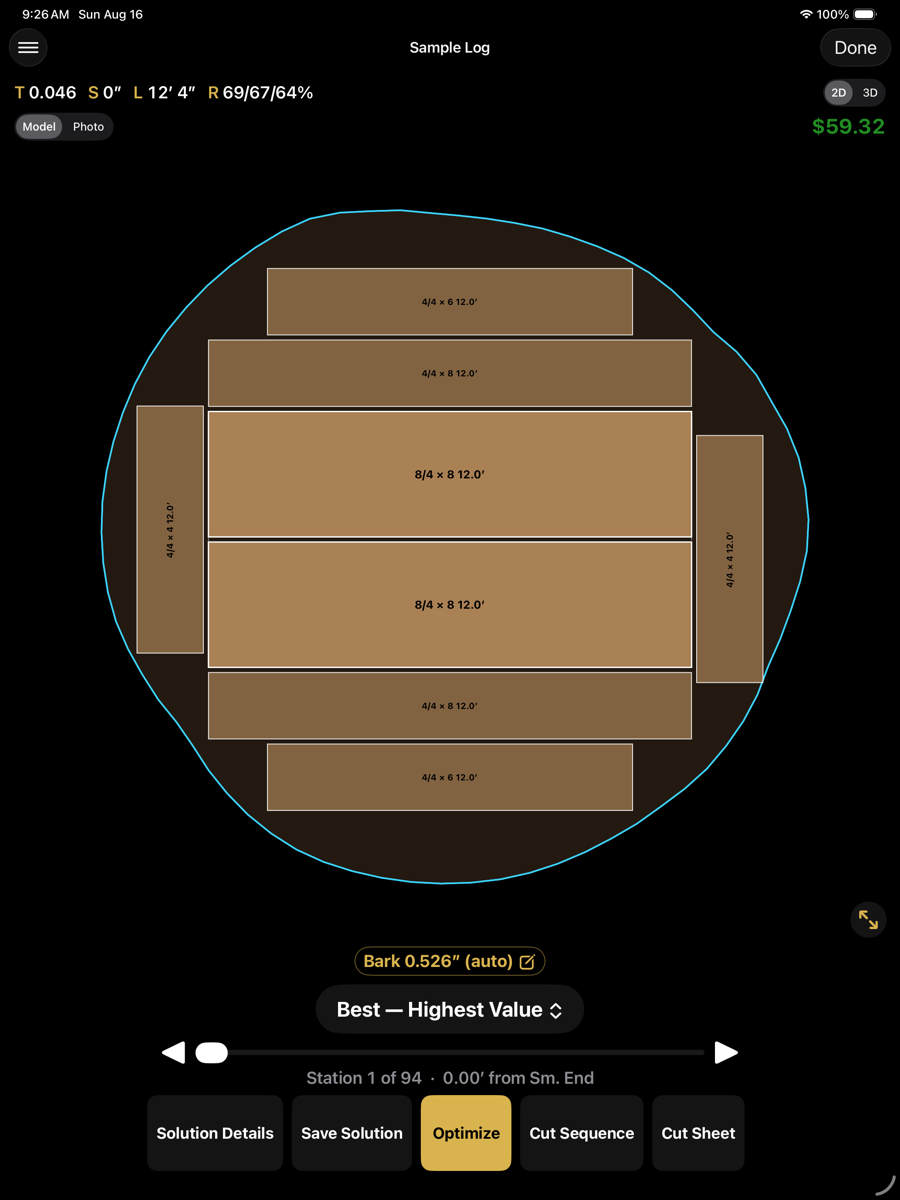
Displayed after a scan has been solved. The centre shows board placement at one station along the log. The surrounding controls change the view or advance to the next stage.
1
2
3
4
5
6
7
8
9
10
11
12
Optimizer screen, iPad
Controls
1
Menu
Opens the optimizer menu: another scan, the setup screens, batch, reports, import and export.
2
Scan name
The scan currently loaded. Long-press to set an alias. Display only; it does not affect the solution.
3
Done
Closes the optimizer and returns to the previous screen.
4
Log readouts
Taper (T), sweep (S), length (L) and recovery (R). Recovery is listed green sawn / green trimmed / finished.
5
2D / 3D
Switches between the cross-section at the current station and the three-dimensional model.
6
Model / Photo
Draws the cross-section over the reconstructed model or over the end photograph.
7
Value
Total value of the current solution, from the active product price list.
8
Cross-section
Board placement at the current station. Each board carries its nominal size and sold length. The blue line is the log boundary at this station.
9
Bark
Bark thickness deducted from the scanned surface. Measured automatically; tap to enter a value and re-optimize.
10
Alternative
The solution being displayed, and the criterion it was chosen by.
11
Station
Position along the log, with the station index and its distance from the small end.
12
Actions
Solution Details, Save Solution, Optimize, Cut Sequence and Cut Sheet.
Value is computed from the active product price list. A value that differs from expectation usually indicates a price-list entry rather than an optimizer fault.
Action row
Action row
Button
Availability
Description
Solution Details
solved
Opens the full figures for this solution: log data, recovery, value and the board list.
Save Solution
solved
Files the solution beside the scan in the project folder. The scan is unchanged and can be re-optimized later.
Optimize
always
Re-runs the optimizer with the current setup and bark allowance.
Cut Sequence
solved
Opens the step-by-step cutting instructions. This is the working output.
Cut Sheet
solved
Generates a printable summary of the cut sequence.
Model, photo and 3D
The same solution drawn three ways.
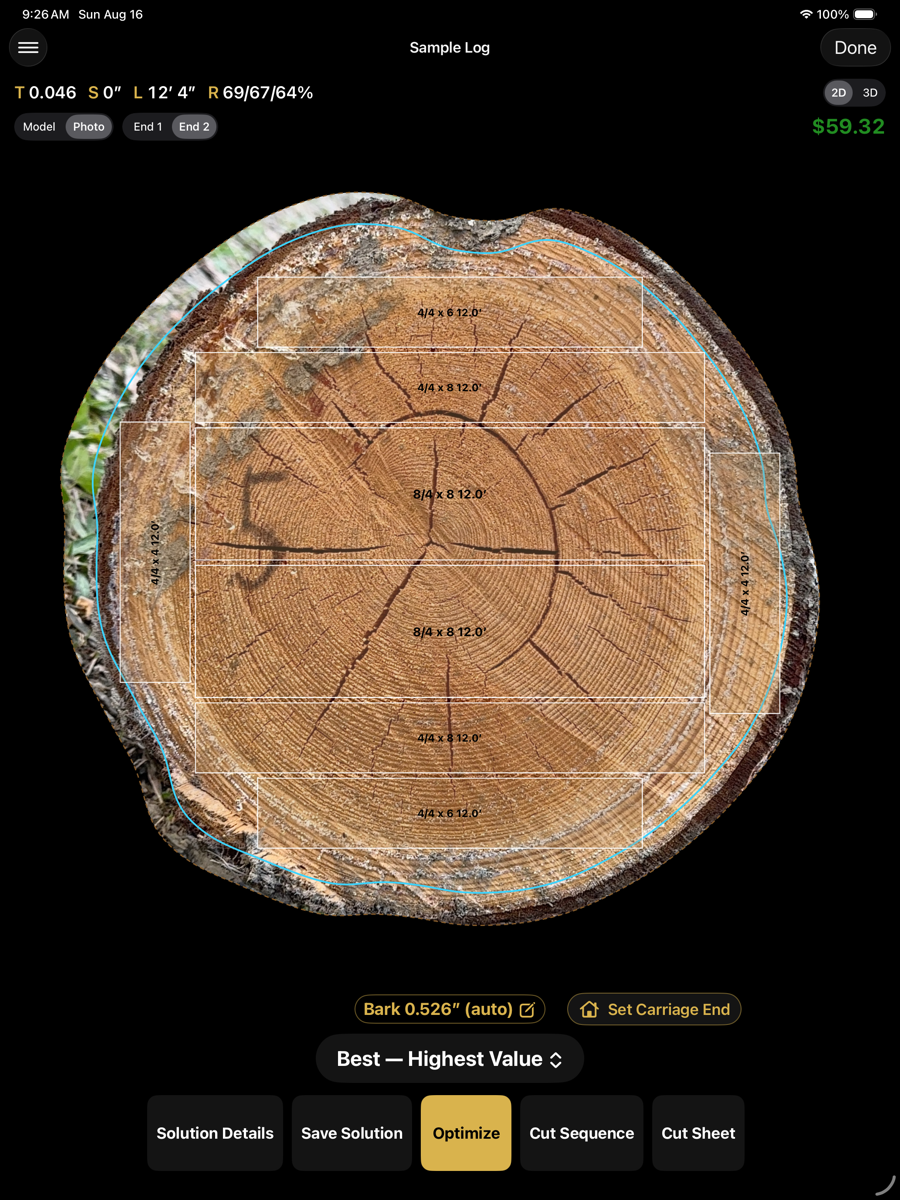
Photo — boards over the end photograph
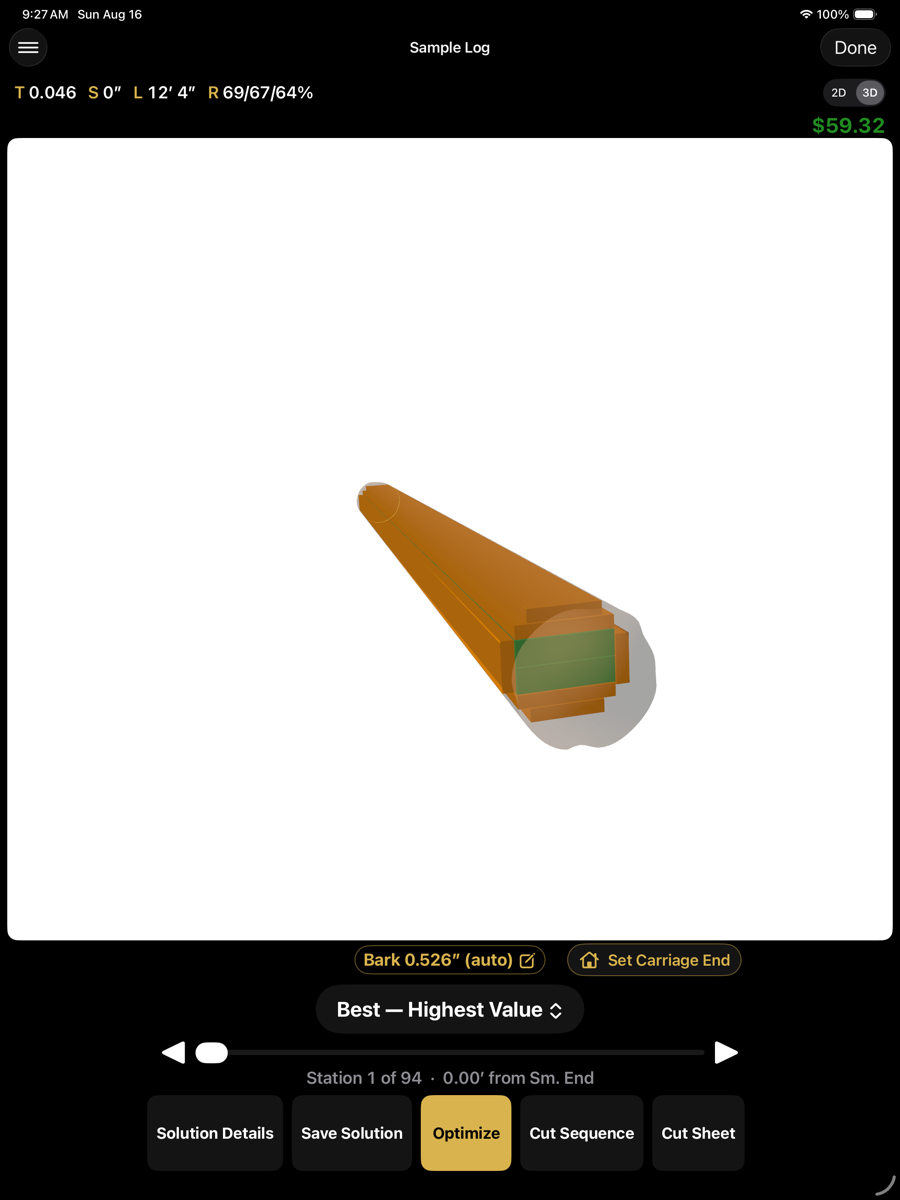
3D — the solution in the log
Order of operations
- Machine setup. Kerf, sawhead resolution, capacity and handling.
- Product setup and pricing. The optimizer maximises value against this list.
- Scan. Walk the length of the log, then capture both end faces.
- Optimize. Load the scan, select the mode, and solve.
- Cut. The cut sequence is the working output: one step at a time, with the turn, lift and saw height for each. A cut sheet can additionally be generated as a printed reference.