Manual › Log Master › Batch optimization
Batch optimization
Solves every scan in the project folder in one run and produces a combined report.

Batch Optimization — the queue before running
The queue
Queue
Element
Example
Description
Report card
top
Opens the report from the previous run, if there is one.
Progress
0 / 8 optimized
How many of the queued scans have been solved.
Queue
scan IDs, queued
Every scan in the project folder, with its state.
Run
top right
Solves each queued scan in turn using the active setup.

The run in progress
The report
Produced at the end of the run and written beside the scans in the project folder.
Report
Element
Example
Description
Header table
one row per scan
Log, scan, length, orientation, recovery green / trimmed / finished, scale, solid, BF, value and board count.
Totals
averages
Recovery figures are averaged; scale, solid, BF and value are summed.
Boards produced
by size and length
Every distinct item, its quantity and its share of the total.
Solutions
one card per scan
The limiting slice of each log — its smallest cross-section — with the roll, recovery, value and board list. An asterisk marks a board sold shorter than the full log length.
CSV
top right
Writes the same data as a spreadsheet.
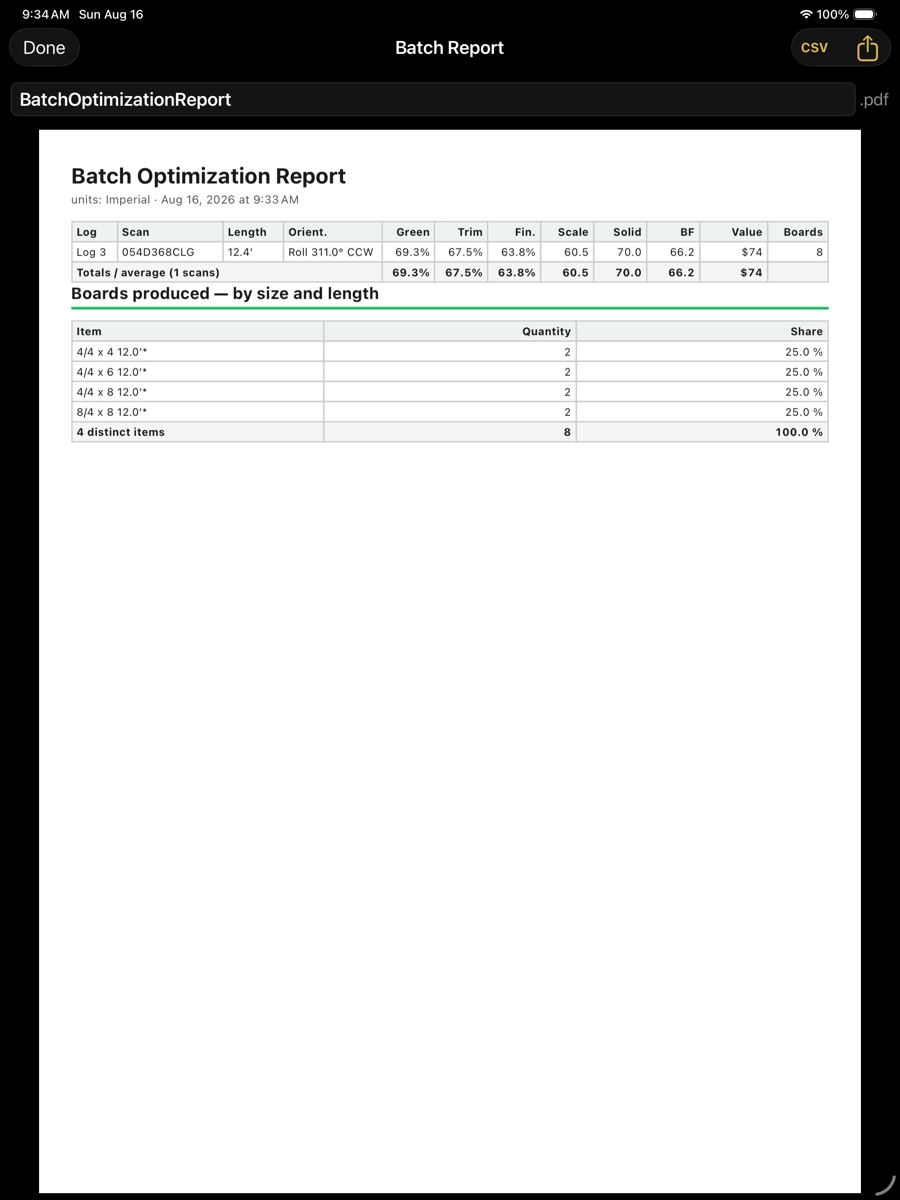
Batch report — summary and boards produced
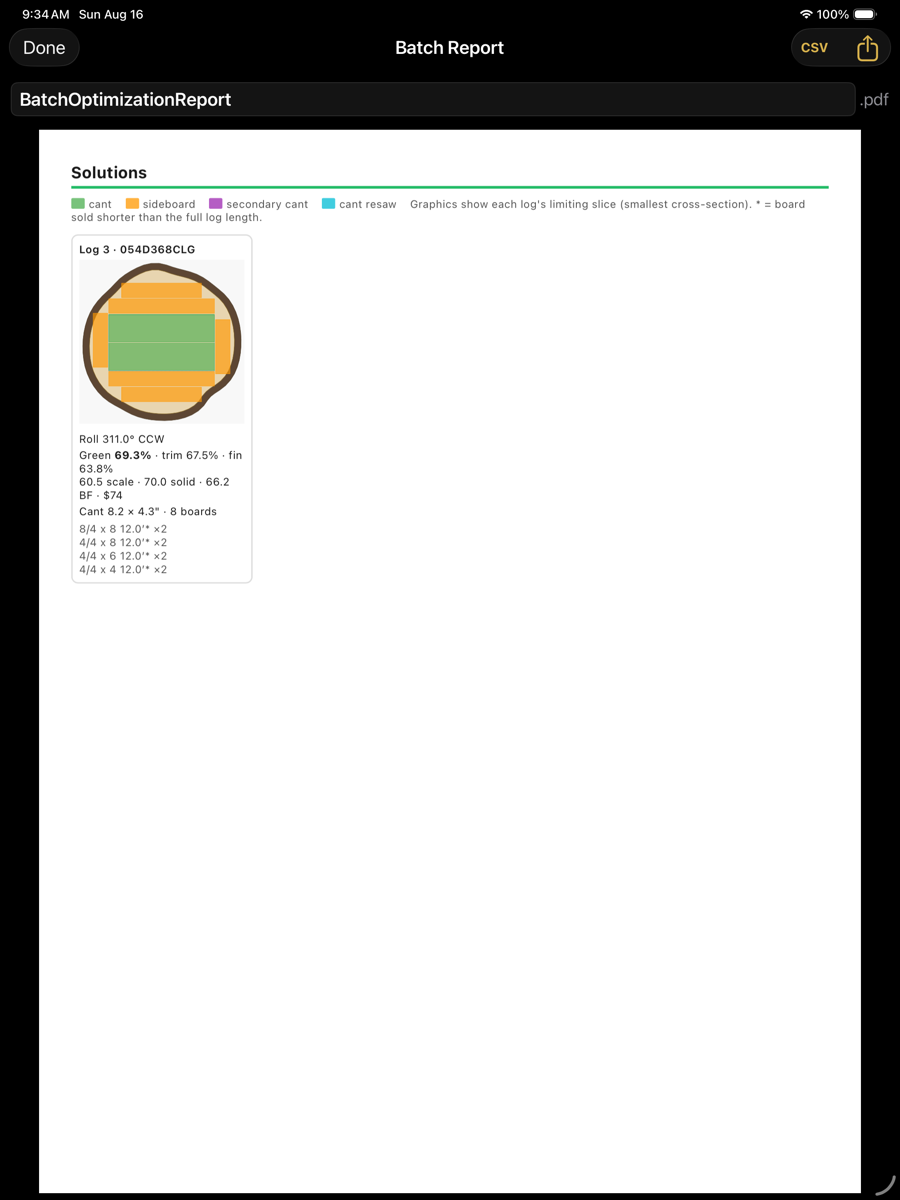
Batch report — one card per log
Every scan is solved with the setup that is active at the time of the run. Changing a data set and running again produces different figures for the same scans.